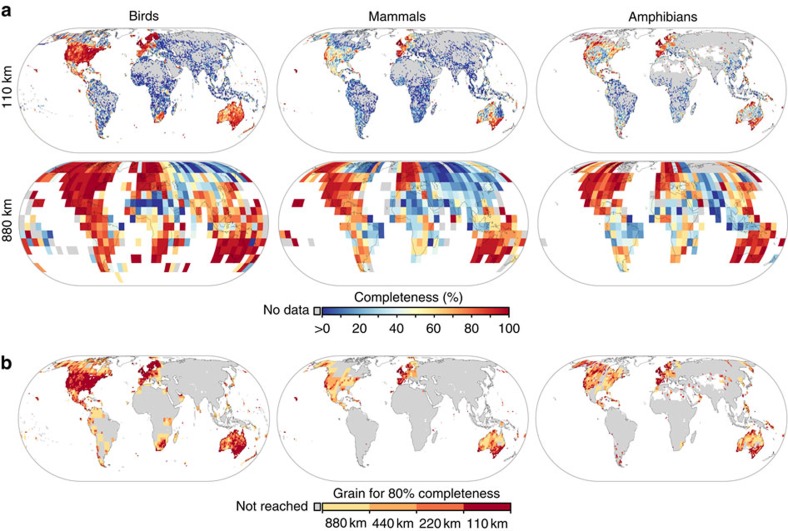
Figure 2. Spatial variation in point record-based inventory completeness for three vertebrate taxa at different spatial grains.
(a) Inventory completeness at the 110- and 880-km grain. (b) Minimum grain size to reach 80% inventory completeness, mapped at 110 km. Grey grid cells (a) show areas within the taxon's global range without mobilized records and (b) areas that do not reach 80% completeness at 880 km.

