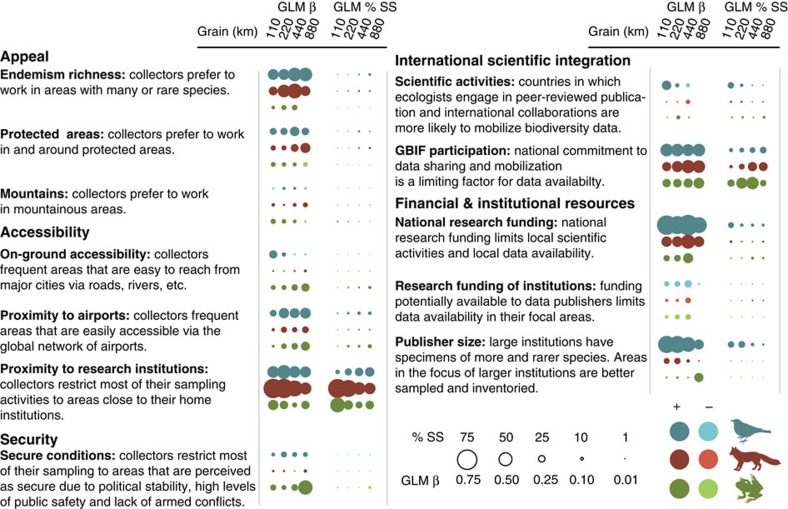
Figure 3. Determinants of inventory completeness in DAI on species distributions.
Effects were tested in multiple generalized linear regression models with a binomial distribution and a logit link (GLM β and GLM % SS). All possible model subsets were ranked based on AIC scores and subsets with ΔAIC<10 re-run as spatial models to account for spatial autocorrelation in model residuals. Bubble size represents the relative strength of predictor–response relationships. Vertebrate groups are represented by different colours, with shading denoting the direction of the relationship. We show the relative importance of predictors using two different metrics: (i) the standardized coefficients of the reduced spatial multiple regression models with the lowest AIC score (blank cells indicate variables that were not included in these models) (GLM β), and (ii) the percentage each predictor has in the total sum of squares (GLM % SS) of a type III analysis of variance.

