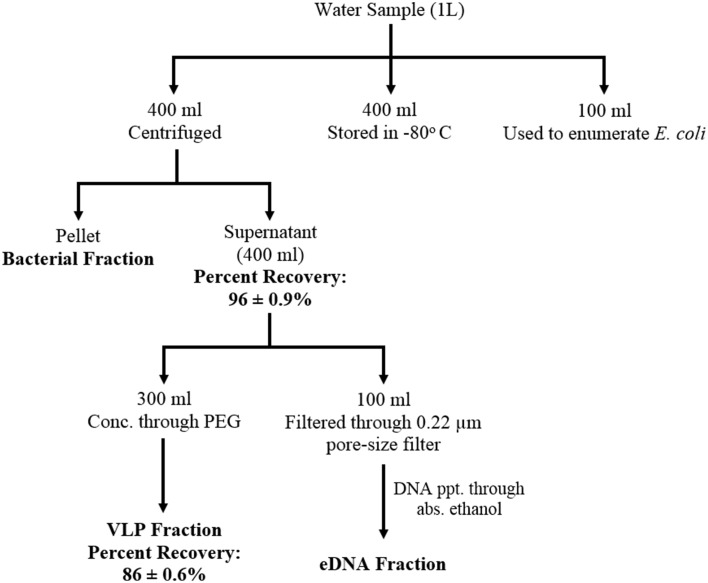
Figure 1.
Schematic diagram showing water sample fractionation steps and the efficiency of the fractionation scheme. Water samples were separated into three distinct fractions: bacterial, VLP (Virus like particles), and eDNA fraction. eDNA is defined as the DNA released in the environment after lysis (natural decay or lysis) of bacteria, viruses, and higher organisms The efficiency of the fractionation scheme was determined as percent recovery of bacteriophage (MHS 16) mixed with the water sample prior to the fractionation steps.

