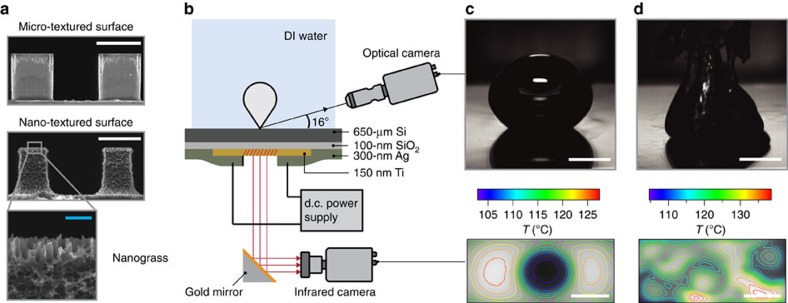
Figure 1. Methodology of boiling experiments.
(a) Parametrically designed micro- and nano-textured boiling surfaces. The micro-textured surface is composed of plain square micropillars (width a=10 μm and height h=12.75 μm) etched onto a 650-μm-thick silicon substrate. In the nano-textured surface, the micropillars are covered by nanograss, which is a nano-texture with a length scale of ∼100 nm. Blue scale bar, 1 μm. White scale bar, 10 μm. (b) Boiling experimental apparatus with heating element and high-speed optical/infrared data acquisition setup. Current passed through a 1 × 2 cm2 Ti thin-film heater on the backside of the silicon substrate induces boiling on its textured top surface. Temperature distribution on the boiling surface is calculated by acquiring an infrared image of the Ti heater from the backside, and correcting for temperature drop across the sample. (c) Optical image of a single bubble on the micro-textured surface with 5 μm-spaced micropillars and the corresponding surface temperature at a low heat flux of q''=20 W cm−2. Scale bar, 5 mm. (d) Optical image of boiling and surface temperature distribution at a high heat flux close to CHF (q''=165 W cm−2, CHF=169 W cm−2). Scale bar, 5 mm.

