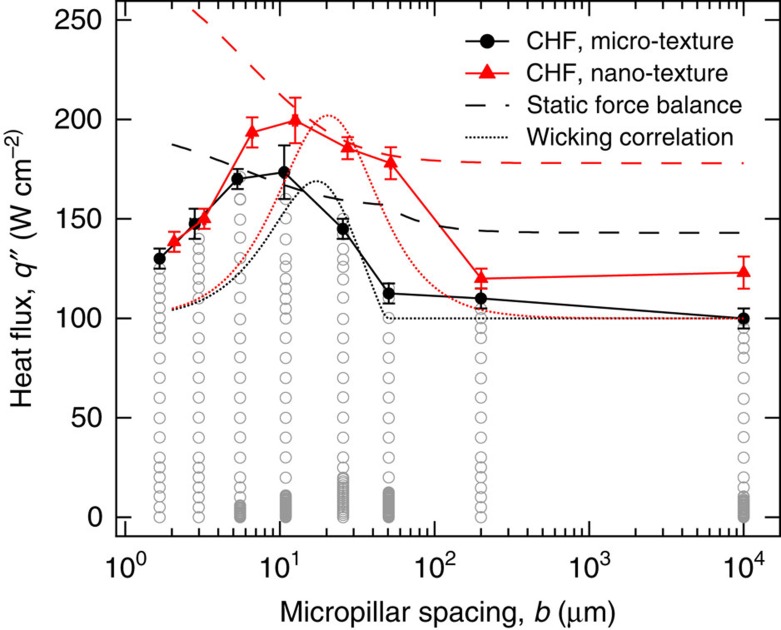
Figure 2. Effect of surface texture on critical heat flux.
Plot of CHF versus micropillar spacing b for both the micro- and nano-textured surfaces. CHF corresponds to the maximum value of applied heat flux q'' (data points shown for the micro-textured surface) that sustained nucleate boiling on the silicon substrate, exceeding which the substrate was damaged by a rapid rise in temperature. The error bar denotes measurement uncertainty and is equal to either the difference of CHF measurements on two nominally similar samples or the maximum heat flux increment (10 W cm−2), whichever is greater (Supplementary Fig. 4 and Supplementary Note 2). CHF for both the micro- and nano-textured surfaces initially increases with decreasing micropillar spacing but falls sharply after reaching a maximum value at b∼10 μm. The static force balance model16,17 incorrectly predicts a monotonic increase in CHF with decreasing micropillar spacing, whereas the liquid wetting-based CHF correlation29 agrees only qualitatively with the experimental data especially for b≤10 μm (Supplementary Note 3).

