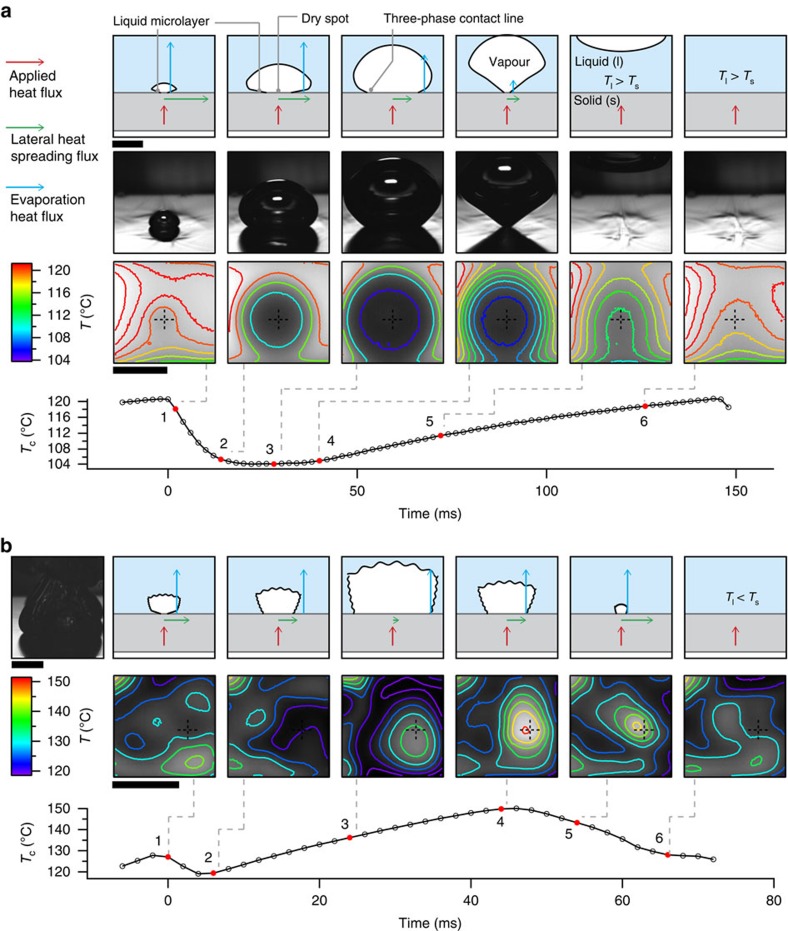
Figure 4. Formation of a hot dry spot at CHF.
Schematic representation and optical/infrared visualization of boiling at low and high heat fluxes on the micro-textured surface with 10-μm-spaced micropillars. (a) At a low applied heat flux of 20 W cm−2, a single periodic bubble forms and departs from the surface. The dry spot formed under the bubble is colder than the surrounding fluid, cooled initially by evaporation of the liquid microlayer37,38 and later by lateral diffusion of heat to the evaporating three-phase contact line. Plot shows variation with time of substrate temperature at the centre of the bubble Tc (cross mark on temperature map). Scale bar, 5 mm. (b) At a high heat flux of 180 W cm−2 close to CHF (185 W cm−2), the formation and collapse of a ‘hot' dry spot is observed on the boiling surface. The dry spot, identified by a hot interior and an evaporation-induced cold periphery, grows to a maximum radius of ∼2–3 mm before being rewetted and cooled by the surrounding liquid. The continuous heating of the dry spot during both its growth and collapse can be attributed to the much larger applied heat flux and comparatively low lateral heat diffusion. Scale bar, 5 mm.

