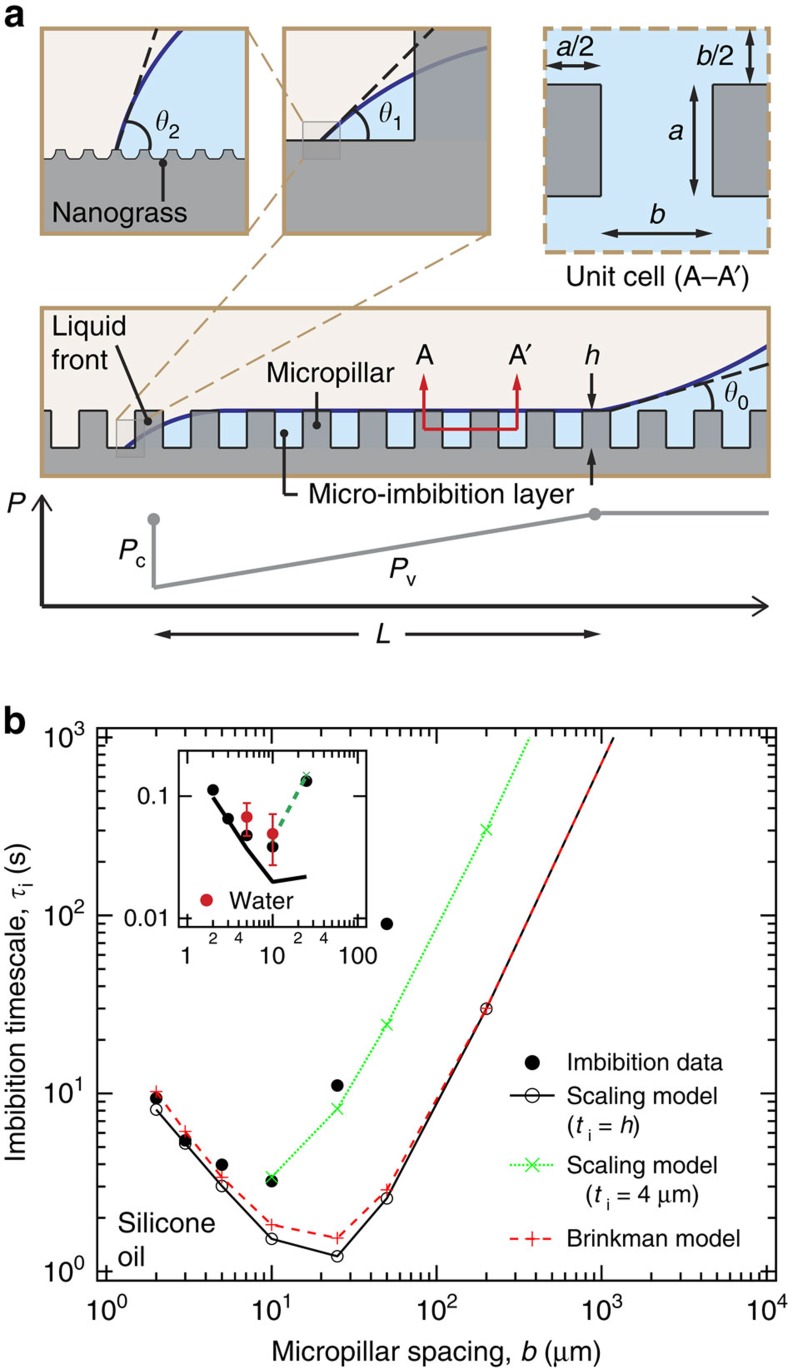
Figure 5. Liquid imbibition into surface micro-textures.
(a) Owing to capillary suction liquid imbibes into the space between the micropillars forming a micro-imbibition layer. The three-phase contact line of the advancing liquid front exhibits different apparent liquid–solid contact angles at different levels of the surface texture hierarchy: surface level (θ0), micro-texture level (θ1), nano-texture level (θ2). The rate of imbibition is determined by a balance between capillary (Pc) and viscous (Pv) pressures. (b) Plot of the experimentally measured and theoretically calculated imbibition time τi for 10 cSt silicone oil to imbibe to a length of 2.5 mm versus the micropillar spacing b of the micro-textured surfaces. The predictions of the simpler scaling imbibition model are almost the same as that of a more complex Brinkman model45,49,50. The imbibition models agree with the experimental data corresponding to an imbibed liquid microlayer thickness ti equal to the micropillar height h for b≤10 μm and ti∼4 μm for b>10 μm. The inset shows the oil imbibition results extrapolated to water (Supplementary Note 5) and verified by independent water imbibition experiments (red dots).

