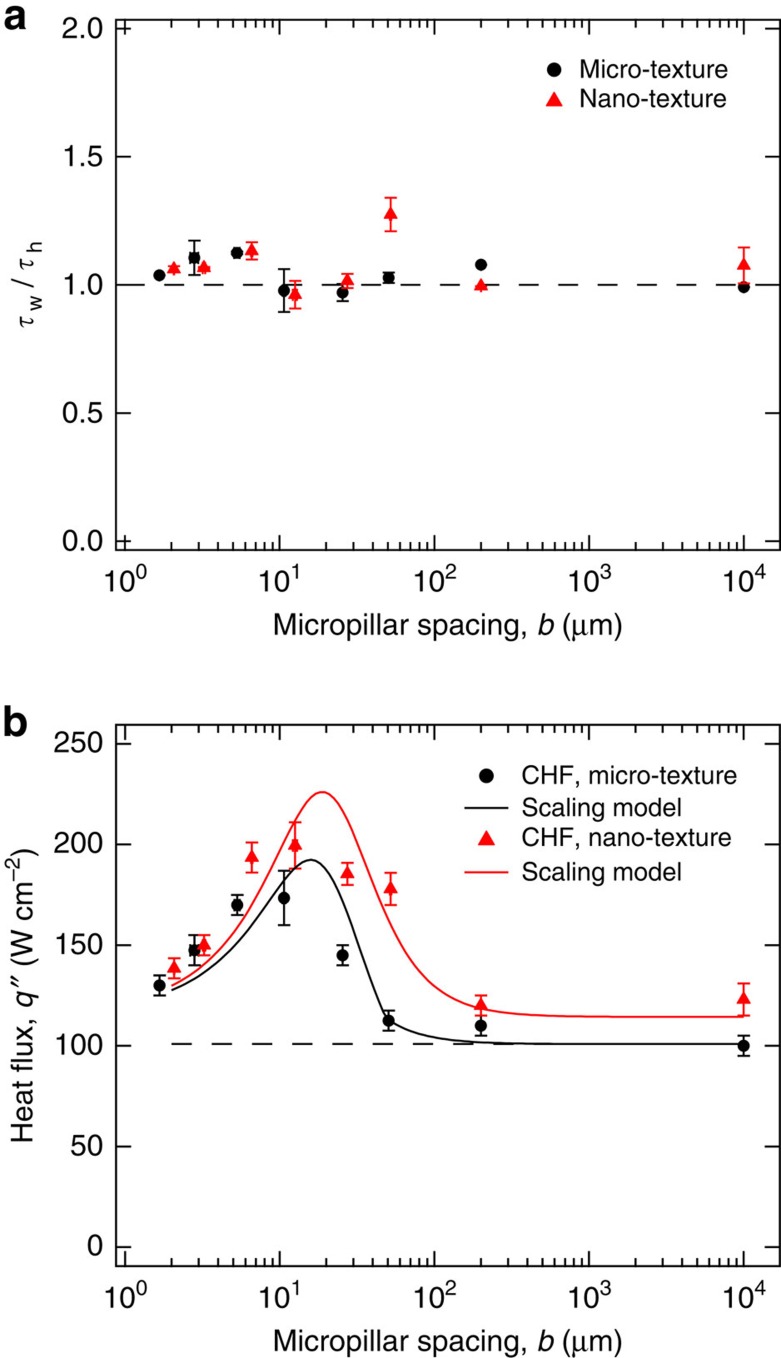
Figure 7. CHF scaling model results.
(a) Plot of the ratio of calculated rewetting (τw) and heating (τh) timescales at the experimentally observed CHF values for both the micro- and nano-textured surfaces versus measured micropillar spacing b. The actual measured values of a, b and h have been used for all the samples (Table 1). The measured contact angle of water on silicon is θ∼30° (see Methods and Supplementary Fig. 5) and Tcrit–To∼12 °C. (b) Plot of experimental CHF data and theoretical curves obtained using the CHF scaling model versus micropillar spacing b for the micro- and nano-textured surfaces. Average micropillar width of a=10 μm and height of h=12.75 μm were used for generating the theoretical CHF curves.

