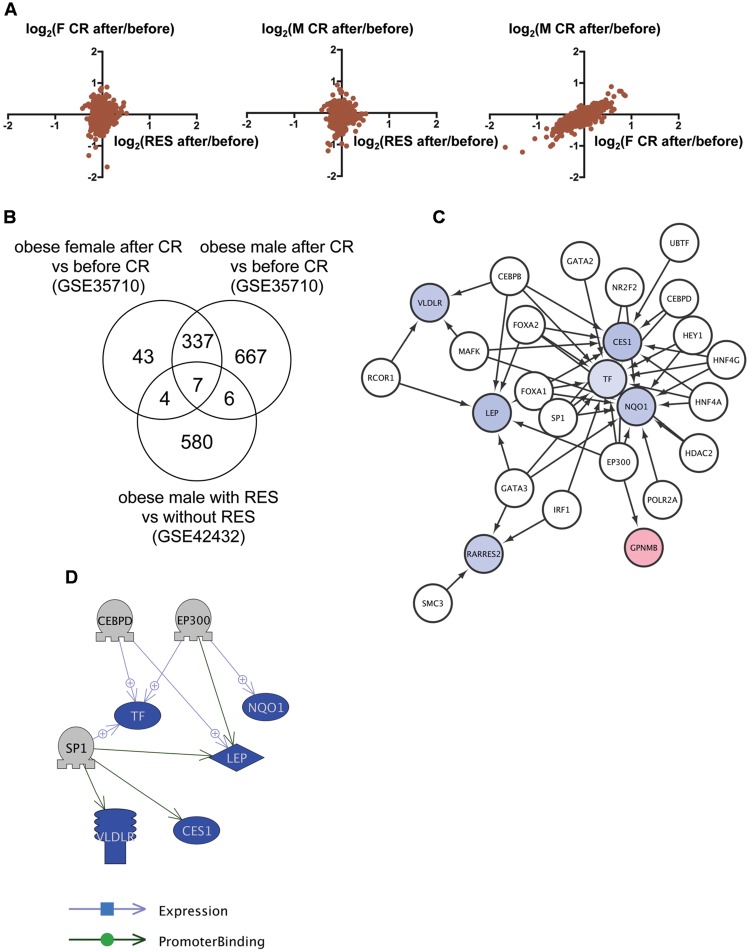
FIGURE 2.
Identification of the regulatory network of genes with changed expression levels common to RSV and CR in obese humans. (A) Correlation of gene expression changes by RSV in obese males and CR in obese females (left) or males (middle) and CR in obese females and males (right). (B) Venn diagram of the numbers of DEG by RSV in obese males, or CR in obese females or males. (C) A regulatory network identified by iRegulon for the seven common genes among RSV in obese males, and CR in obese females and males. Genes shown in blue and red indicate decreased and increased expression, respectively, by RSV or CR. (D) A regulatory network identified by Pathway Studio between three regulators and their five target genes. Genes shown in blue and red indicate decreased and increased expression, respectively, by RSV or CR.

