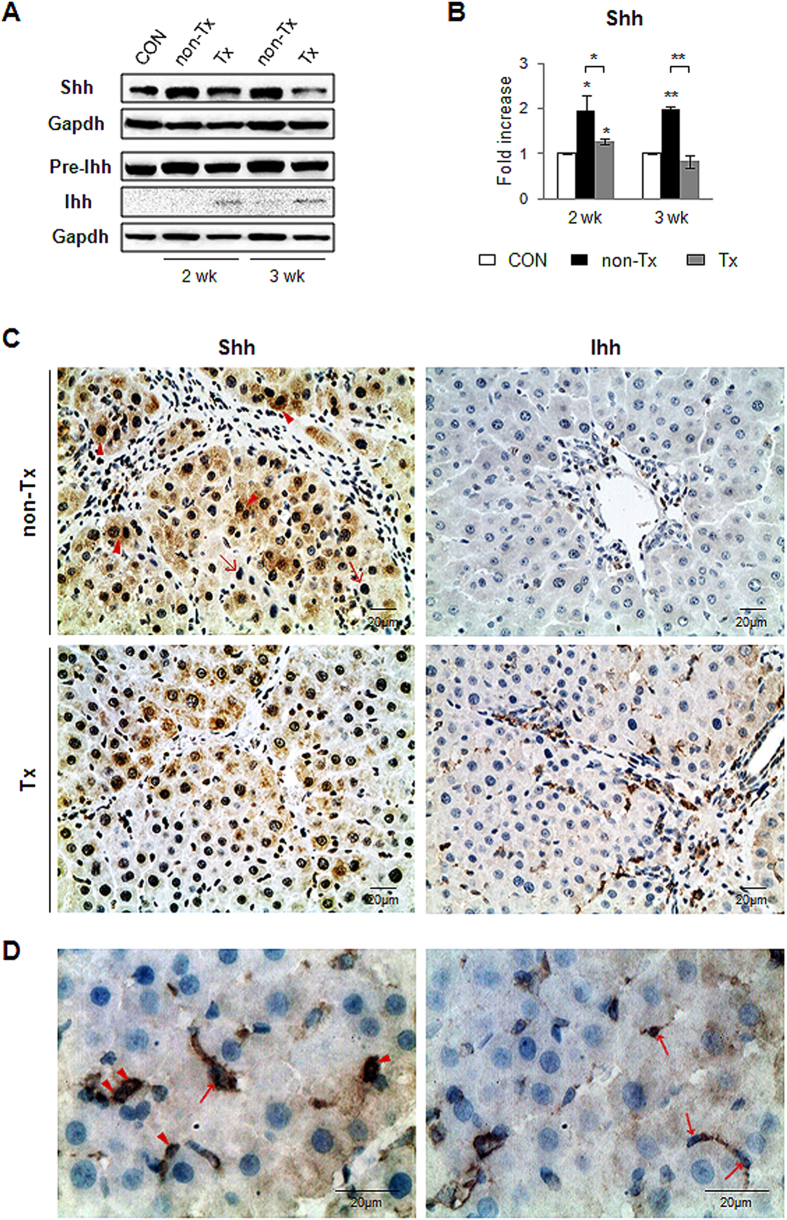
Figure 1. Hh ligands, Shh and Ihh, are differentially expressed in liver of Tx rats.
(A,B) Western blot analysis for Shh (27 kDa), Ihh (19 kDa: processed form/42 kDa: precursor form) and Gapdh (36 kDa, as an internal control). Data shown represent one of three experiments with similar results ((A) immunoblot/(B) band intensity). The mean ± SD results obtained by measuring the band density of three different blots are graphed (*p < 0.05, **p < 0.005 vs. control). (C) Immunohistochemistry for Shh and Ihh in liver sections from representative non-Tx and Tx rats at two weeks post transplantation (×40). Shh-positive and -negative hepatocytes are indicated by arrowhead and arrow, respectively. (D) Magnified image of Ihh-positive hepatic oval- and stellate-looking cells indicated by arrowhead and arrow, respectively (×100).

