. 2015 Sep 15;4:e07068. doi: 10.7554/eLife.07068

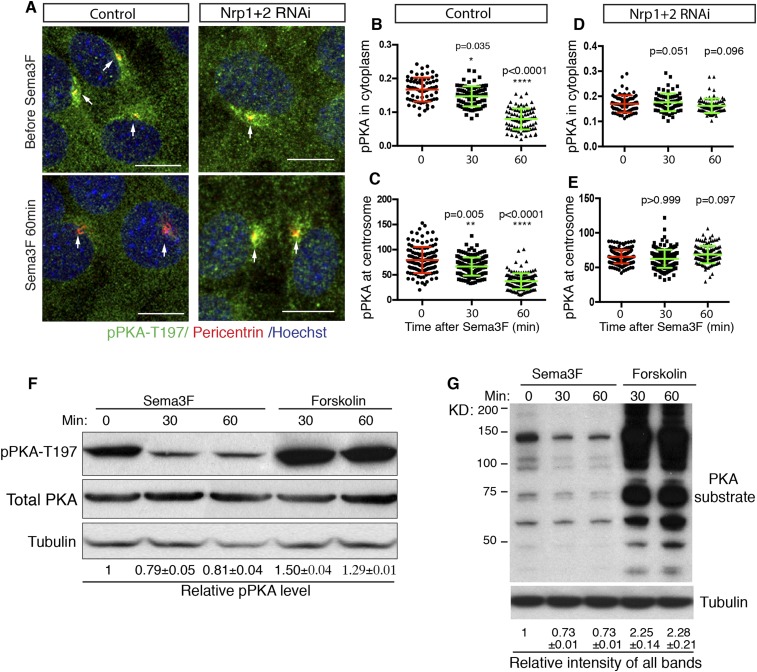
Figure 3. Sema3-Nrp signaling inhibits PKA activity.

(A) Immunofluorescence showing active PKA in NIH3T3 cells after Sema3F treatment. Cells were infected with lentiviruses expressing control shRNA or shRNA against Nrp1&2 for 72 hr. Active PKA is recognized by the antibody against phospho-PKA T197 (green). Scale bar, 10 μm. (BE) Quantification of phospho-PKA level at the cytoplasm and centrosome. Data are shown as mean ± SD. Statistics: Kruskal–Wallis non-parametric One-Way ANOVA. (F) Western blot showing the phospho-PKA and total PKA levels in NIH3T3 cells treated with Sema3F or Forskolin for indicated time periods. Quantification of relative active PKA level (mean ± SEM) from three independent experiments was shown at the bottom of each blot. (G) Western blot showing the levels of PKA substrate phosphorylation in NIH3T3 cells treated with Sema3F or Forskolin for indicated time periods. Quantification of the relative intensity of all bands in each lane (mean ± SEM) from three independent experiments was shown at the bottom.

DOI: http://dx.doi.org/10.7554/eLife.07068.008

Figure 3.

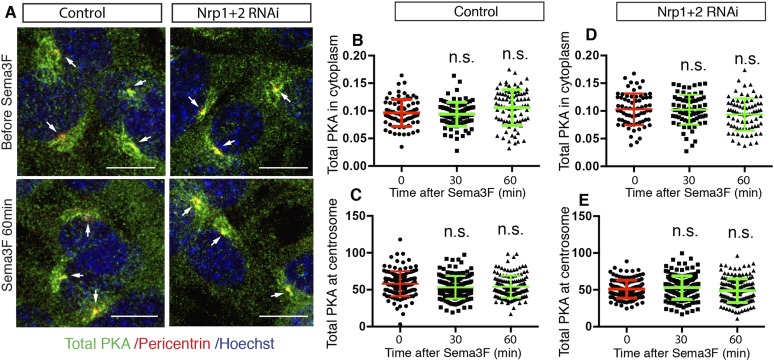
Figure 3—figure supplement 1. Sema3-Nrp signaling does not change total PKA level.

Figure 3—figure supplement 1.

(A) Immunofluorescence showing total PKA in NIH3T3 cells after Sema3F treatment. Cells were infected with lentiviruses expressing control shRNA or shRNA against Nrp1&2 for 72 hr. The antibody that recognizes total PKA stains for both phosphorylated and non-phosphorylated PKA (green). Scale, 10 μm. (BE) Quantification of total PKA level at the centrosome. Data are shown as mean ± SD. Statistics: Kruskal–Wallis non-parametric One-Way ANOVA.
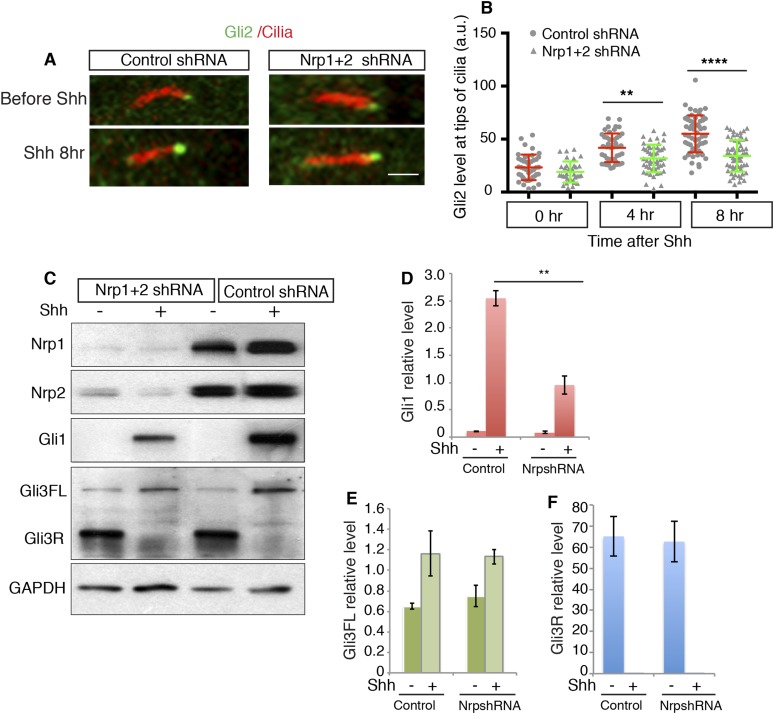
Figure 3—figure supplement 2. Sema3-PKA signaling enhances Shh-induced Gli2 enrichment to the cilia tip, but does not affect Gli3 processing.

Figure 3—figure supplement 2.

(A, B) NIH3T3 cells were infected with lentivirus expressing control or Nrp shRNA for 72 hr. After Shh treatment, cells were stained with Gli2 and acetylated tubulin (Red). Gli2 intensity at the cilia tips (arrows) was measured (B). (C) 72 hr after lentivirus-mediated RNAi, cells were treated with Shh for 24 hr. Cell lysate was then used in Western Blot to detect Gli1 induction and Gli3 processing. (DF) Quantification of the intensity of Gli1, Gli3 full length and Gli3 repressor from 3 independent experiments. Data are mean ± SD. Statistics: non-parametric Mann–Whitney test. **p < 0.01, ****p < 0.0001. Scale, 2 μm. Abbreviation: Gli3FL, Gli3 full length. Gli3R: Gli3 repressor.