. 2015 Sep 15;4:e07068. doi: 10.7554/eLife.07068

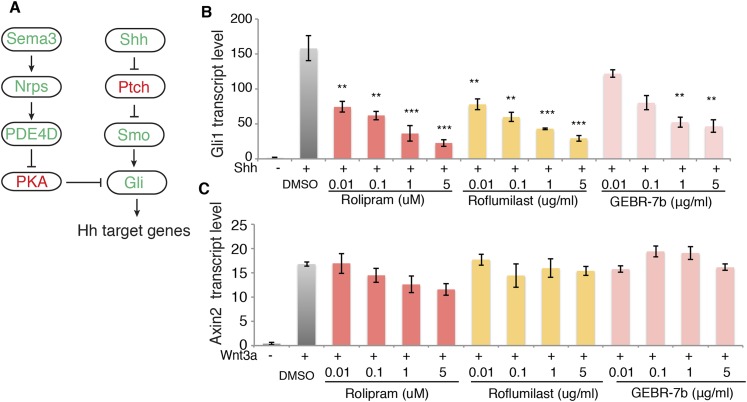
Figure 4. PDE4D inhibitors suppress Hh signal transduction.

(A) Schematic diagram showing that Sema3-Nrp signaling regulates Hh pathway through controlling the activity of PDE4D and PKA. (B) The Hh signaling activity in NIH3T3 cells incubated with PDE4D inhibitors together with Shh conditioned medium for 4 hr Gli1 transcript levels were measured by qPCR to evaluate the Hh signal transduction. (C) The Wnt signaling activity in NIH3T3 cells incubated with PDE4D inhibitors together with Wnt3a for 4 hr Axin2 transcript levels were measured by qPCR to evaluate the Wnt signal transduction. All data are mean ± SEM. Statistics: Student t-Test, in comparison to the condition where cells were treated with DMSO. **p < 0.01, ***p < 0.001.

DOI: http://dx.doi.org/10.7554/eLife.07068.011

Figure 4.

Figure 4—figure supplement 1. PDE4D inhibitors suppress SAG-induced Hh signal transduction.

Figure 4—figure supplement 1.

(A) Chemical structure of the PDE4D inhibitors used in the assays. (B) The Hh signaling activity in NIH3T3 cells incubated with PDE4D inhibitors together with SAG for 4 hr Gli1 transcript levels were measured by qPCR to evaluate the Hh signal transduction. All data are mean ± SEM. Statistics: Student t-Test, in comparison to the condition where cells were treated with DMSO. **p < 0.01, ***p < 0.001.
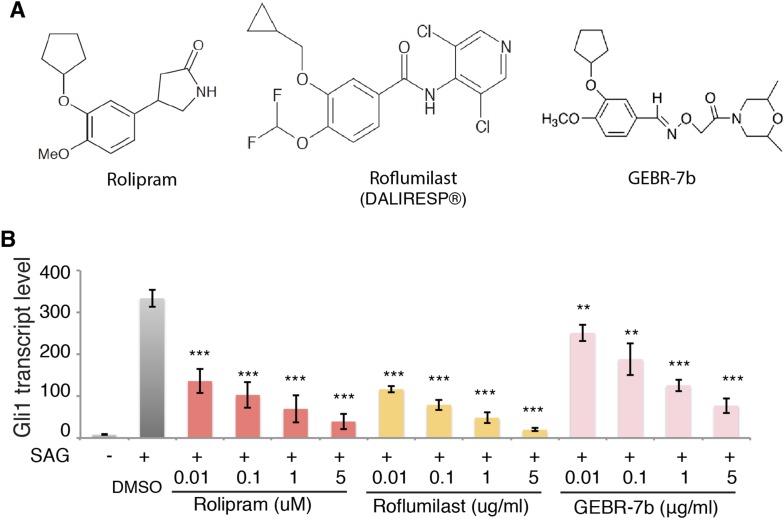
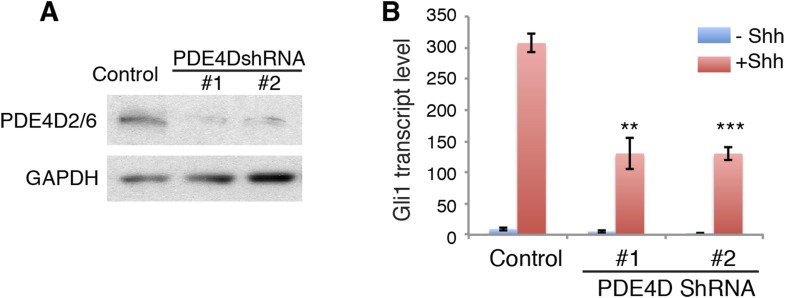
Figure 4—figure supplement 2. PDE4D knockdown reduces Hh signaling activity.

Figure 4—figure supplement 2.

(A) Western blot shows that lentivirus-mediated expression of shRNA against PDE4D abolished the expression of endogenous PDE4D2/6. (B) On day 3, Hh signaling activity was evaluated after cells were treated with Shh. Gli1 transcript level was measured by qPCR to evaluate Hh signaling activity. Data are mean ± SEM. Statistics: Student's t-Test. **p < 0.01, ***p < 0.001.