. 2015 Sep 15;4:e07068. doi: 10.7554/eLife.07068

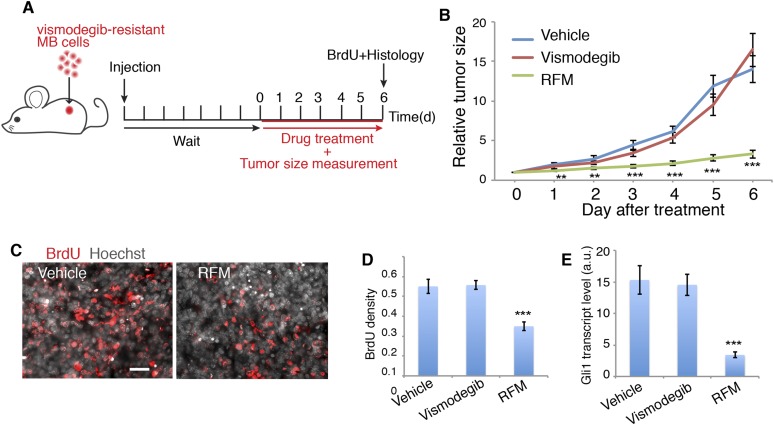
Figure 7. PDE4 inhibitors suppress Hh signal transduction and Hh-related tumor growth.

(A) Schematic diagram of the MB tumor allograft experiment in mouse. Drug treatment started 6 day after injection when the size of tumors could be accurately measured. (B) The relative tumor size is defined as the tumor volume on the indicated day divided by that on day 0. For each drug 9–10 mice were used. (C, D) BrdU density in tumors after drug treatment. Scale: 50 μm. (E) Hh signal transduction in tumors was assessed by Gli1 transcription level through qPCR. RFM: roflumilast. Error bars represent SEM. Statistics: Student's t-Test. **p < 0.01, ***p < 0.001.

DOI: http://dx.doi.org/10.7554/eLife.07068.017

Figure 7.

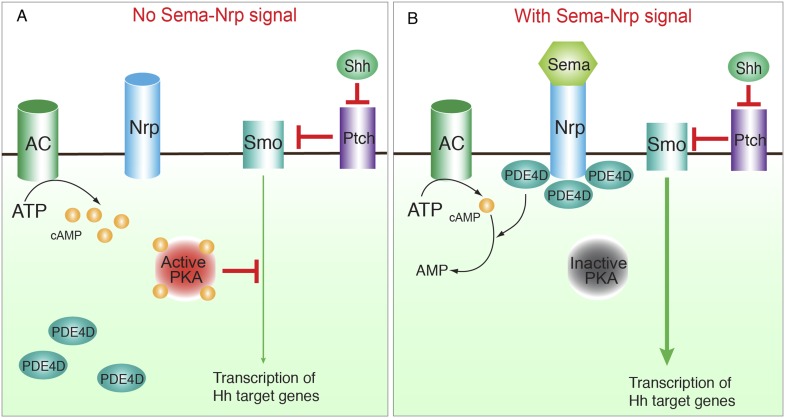
Figure 7—figure supplement 1. Schematic view of the integration of Sema3-Nrp with the Hh signal pathway by controlling PKA and PDE4.

Figure 7—figure supplement 1.

(A) Without Sema3 or Nrps, the majority of PDE4D resides in the cytoplasm rather than being associated with the cell membrane, where cAMP is produced by AC. As peri-membrane cAMP is not easily accessible to cytoplasmic PDE4D for degradation, its concentration remains high, which leads to high PKA activity and inhibition of Hh signaling. (B) In the presence of Sema3 and Nrps, PDE4D is recruited to the cell membrane and thus brought into close proximity to its target cAMP. This results in reduced cAMP concentration in the entire cell and at the cilium base. Consequently PKA is inhibited, which promotes Hh signal transduction. In this process, inhibition of PKA by Sema3-Nrp signal per se is insufficient to turn on Hh signaling; instead it enhances Hh signaling once Shh turns on the pathway. Abbreviations: AC: Adenylyl Cyclase; PDE4D: Phosphodiesterase 4D; Nrp: Neuropilin.