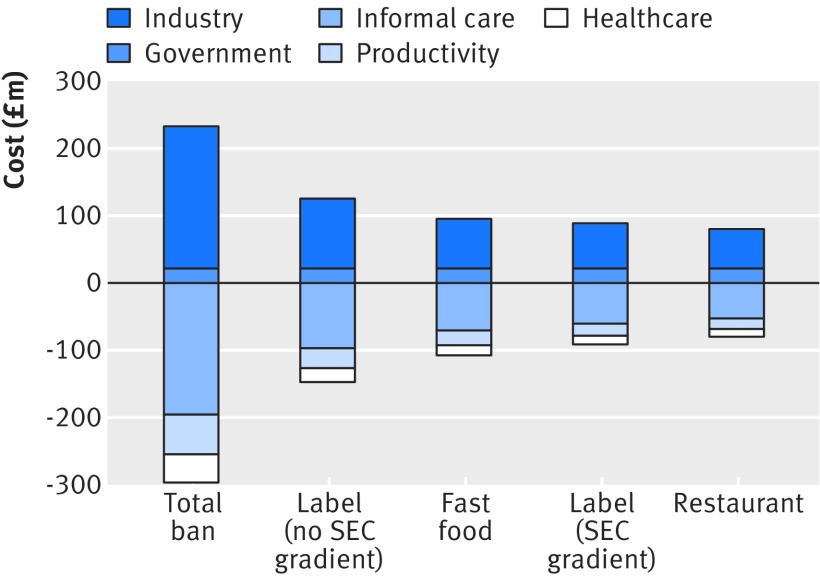
Fig 1 Contributions of each cost category for each policy option for reduction in trans fatty acids. Costs to government and industry are expressed as positive and savings from reductions in direct healthcare, productivity loss, and informal care are expressed as negative. (Confidence intervals on savings are shown in table 6; net costs are shown in table 7 and fig 2)

An official website of the United States government
Here's how you know
Official websites use .gov
A
.gov website belongs to an official
government organization in the United States.
Secure .gov websites use HTTPS
A lock (
) or https:// means you've safely
connected to the .gov website. Share sensitive
information only on official, secure websites.
