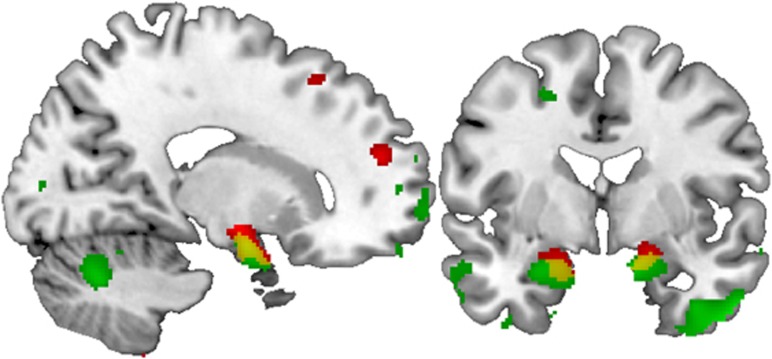
Figure 1.
Coronal (y=−2) and sagittal (x=17) views of the amygdala and the hippocampus region depicting the effect of NCAN rs1064395 genotype on gray matter volumes in the two samples, as corrected for gender and age and rendered on a standard brain template in MNI space. Green, results from sample 1 (healthy subjects) showing N=389 GG homozygotes >N=123 A-carriers with a threshold of p<0.01. Red, results from sample 2 (MDD) showing N=124 GG>N=47 A-carriers at the same statistical threshold. Yellow, overlap between the clusters of each sample with a combined threshold of p<0.001.

