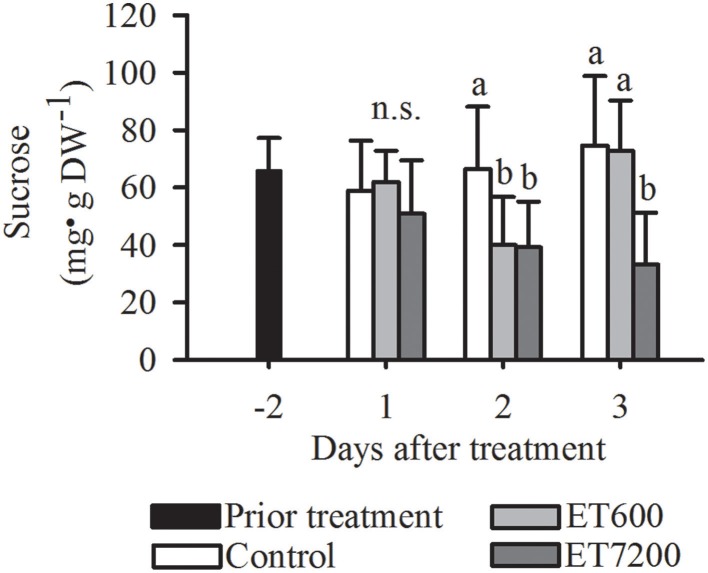
Figure 5.
Sucrose concentration of pea sized fruitlets after the ethephon treatment 600 ppm (ET600) or 7200 ppm (ET7200) in comparison to the control at 1, 2, and 3 days after treatment. Homogeneous subgroups with no significant difference (p ≤ 0.05) are indicated by same letters. Error bars show standard deviation.

