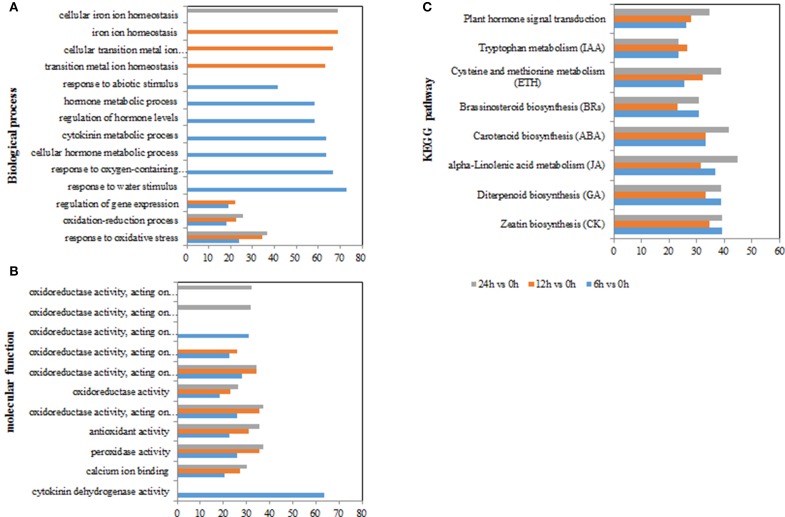
Figure 4.
GO terms and KEGG pathways involved in ROS and hormones production in Populus tomentosa under salt treatment. (A) Biological process GO terms; (B) Molecular function GO terms; (C) KEGG pathways. The x-axis in (A,B) indicates the percentage of DEGs numbers vs. background gene numbers in each GO term; the x-axis in (C) indicates the percentage of DEGs numbers vs. background gene numbers in each KEGG pathway. The detailed information is shown in Supplementary Tables S4, S5 and Table 3.

