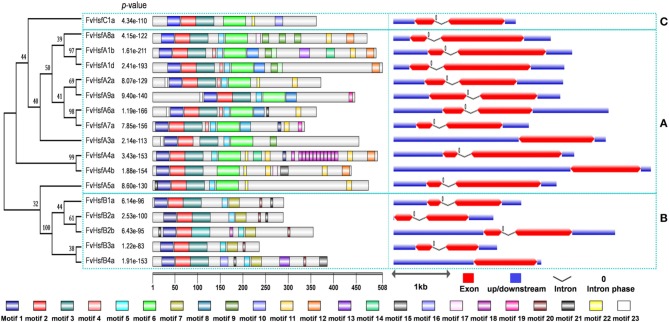
Figure 2.
Structural analysis of strawberry Hsf genes. The protein domains of the strawberry Hsf genes are shown on the left and are denoted by rectangles with different colors. The exon-intron organization is shown on the right, with exons and introns represented by red wedges and black lines, respectively, and untranslated regions (UTRs) indicated by blue boxes. The number 0 represents the intron phase. The exon size can be estimated using the scale at the bottom of the diagram, while all of the introns were set to same length. The blue dashed rectangles are used to cluster the genes into the A, B, and C classes.

