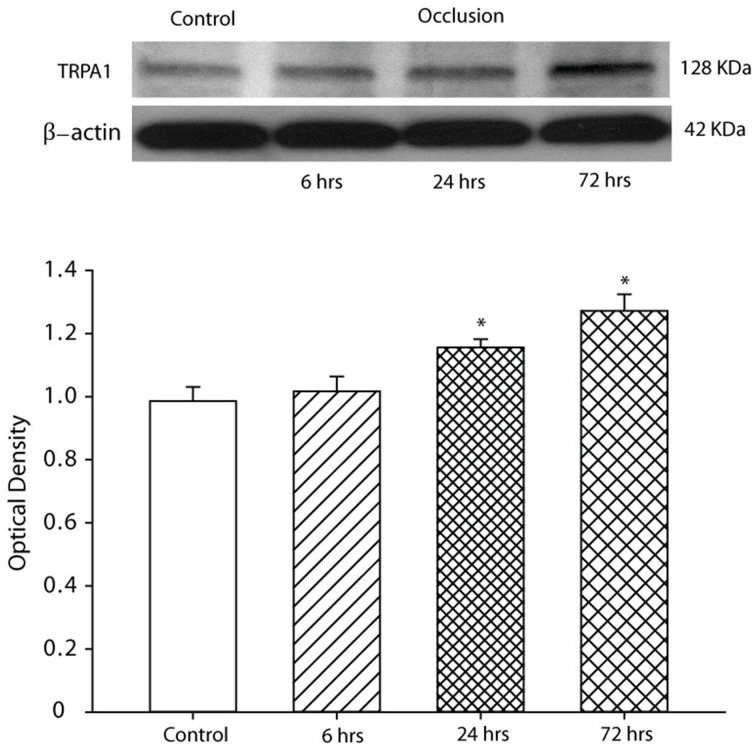
Figure 2.
Effects of femoral artery occlusion on TRPA1 expression at different time courses. Western blot analysis was used to examine the protein levels of TRPA1 in DRG tissues. Top: representative bands of TRPA1 expression. Bands of β-actin are used as control for an equal protein loading. Bottom: average data. The optical density is expressed in arbitrary units normalized against a control sample. Data in histograms represent means ± SEM; n = 6 in each group. *P < 0.05 vs. control.

