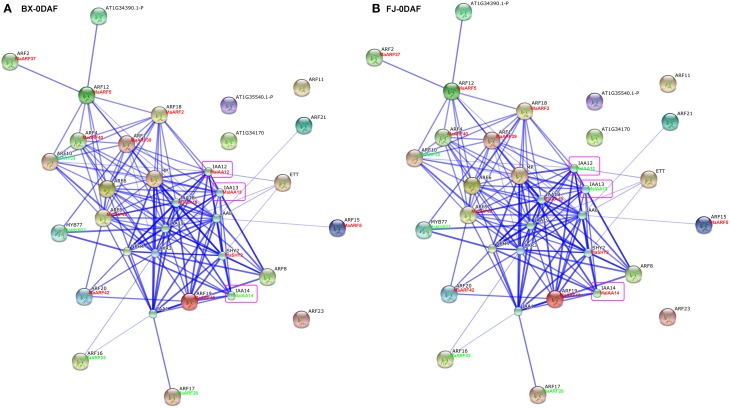
Figure 7.
Interaction network and co-expression analyses of ARF genes at 0 DAF stage of fruits in BX (A) and FJ (B) varieties of banana and related genes in Arabidopsis. Line thickness relates to combined score. The homologous genes of banana are in parentheses. The genes marked with red font show high expression levels (value > 10). The genes marked with green font show low expression levels (value < 10). The genes boxed by purple indicate their differential expression patterns between BX and FJ.

