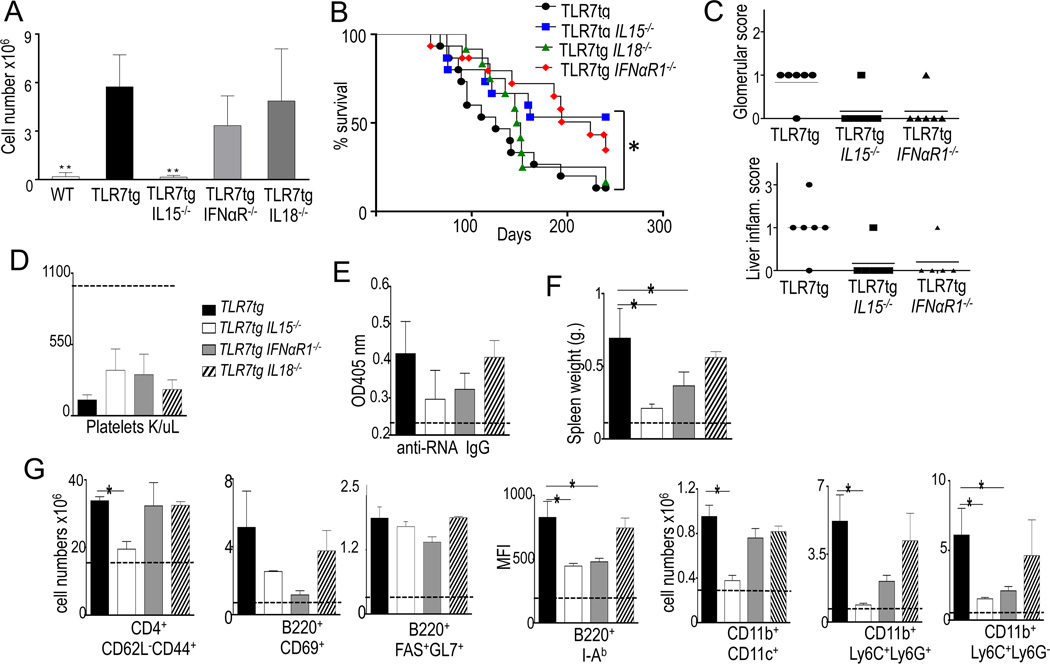
Figure 2. IL15 deficiency delays the development of autoimmune disease in TLR7tg mice.
(A) Numbers of splenic NK1.1+CD11c+ cells in each genotype shown, at least three mice per group. **p<0.01(Student t-test); (B) Survival curve for TLR7tg, TLR7tg.IL15−/− and TLR7tg.IFNαβR1−/− mice, 15 mice per group. (C ) Glomerular damage in kidney and liver inflammation scores measured as described in methods; Mice of the genotype shown, were analyzed for number of platelets (D), total serum IgG and anti-RNA IgG antibodies (E), spleen weight (F), splenocyte count (G); Data collected from three experiments with three mice per group. Asterisk represents p≤ 0.05 in Anova statistical analysis and Kaplan-Meier for survival curve.

