. 2015 Sep 15;16:111. doi: 10.1186/s12863-015-0263-3
© Wang et al. 2015
Open Access This article is distributed under the terms of the Creative Commons Attribution 4.0 International License (http://creativecommons.org/licenses/by/4.0/), which permits unrestricted use, distribution, and reproduction in any medium, provided you give appropriate credit to the original author(s) and the source, provide a link to the Creative Commons license, and indicate if changes were made. The Creative Commons Public Domain Dedication waiver (http://creativecommons.org/publicdomain/zero/1.0/) applies to the data made available in this article, unless otherwise stated.
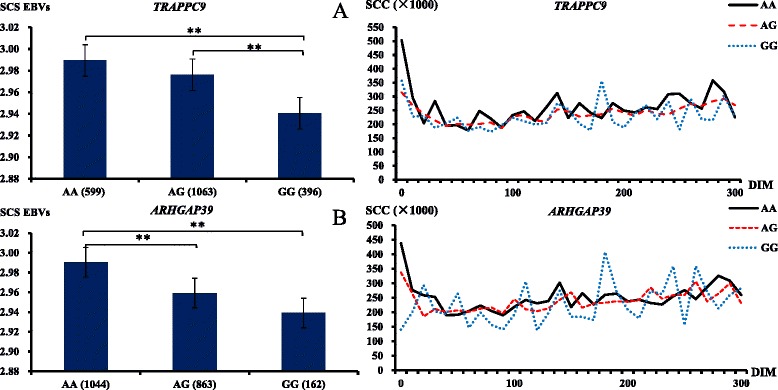
Fig. 3.

The SCS EBVs and curves of SCC in different genotypes of TRAPPC9 and ARHGAP39 genes. **refers to P < 0.001
