Figure 2.
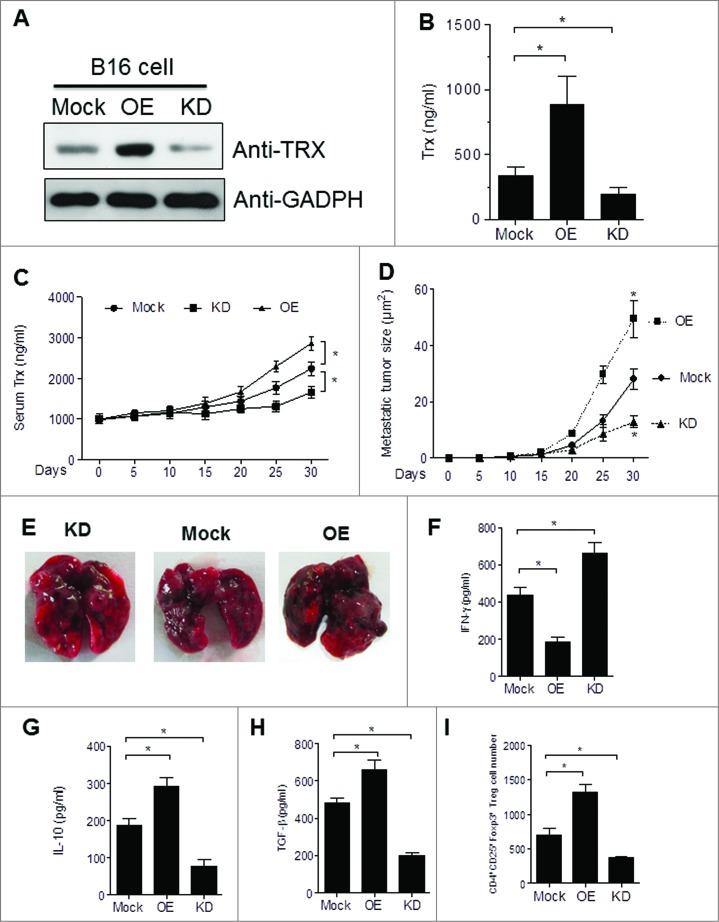
TRX levels correlate with the Treg number in the tumor microenvironment to inhibit T-cell response. (A) Western bolt analysis of thioredoxin (TRX) protein level in B16 cells transfected with empty vector (Mock) or pcDNA3.1-TRX overexpression (OE) or TRX shRNA knockdown (KD). (B) ELISA analysis of TRX protein level in serum-free conditioned medium from transfected B16 cells cultured 24 h. (C) ELISA analysis of serum TRX protein level in blood sera of B16 tumor-bearing mice. (D) Metastatic tumor size in lung from B16 cell tumor-bearing mice (n = 6). (E) Representative image of lung metastases from B16 tumor bearing mice at day 30. (F-H) ELISA analysis of serum interferon γ (IFNγ), interleukin 10 (IL10) and transforming growth factor β (TGFβ) protein levels from tumor-bearing mice (n = 6) 20 d after B16 cell injection. (I) Transfected B16 cells were injected into C57/B6 mice for 3 weeks then tumor-infiltrating regulatory T cell (Treg) numbers per 200 mg tumor sample were calculated in tumor-bearing mice (n = 6) by immunofluorescence staining and cytofluorimetric analysis. Statistical analysis was performed by Student's t-test; *P < 0.05.

