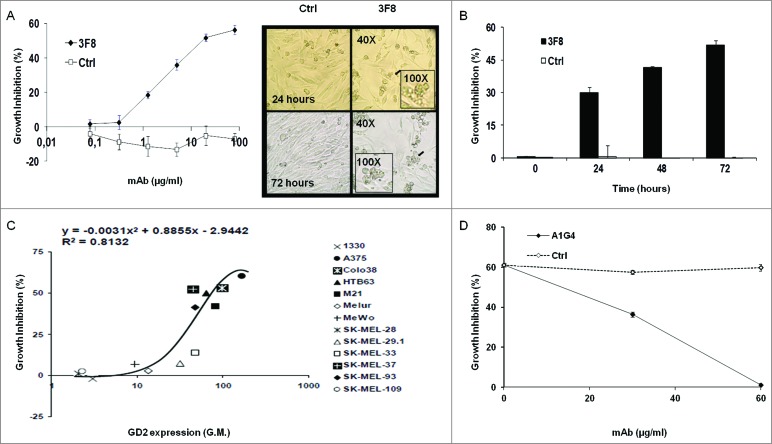
Figure 1.
Inhibition by GD2-specific mAb 3F8 of GD2(+) human melanoma cell line growth. (A and B) HTB63 cells were seeded in flat bottom 96-well plates (3 × 10³/well) and incubated with the indicated concentrations of mAb 3F8. mAb HO-1 was used as an isotype matched control (Ctrl). Following an up to 72 h incubation at 37°C in a 5% CO2 atmosphere, cell growth inhibition was determined by Cell Counting Kit-8 (CCK-8) assay (A) (left panel). Cell density and morphology of HTB63 cells were monitored under a bright field light microscope. Representative results of HTB63 cells treated with the mAb 3F8 or the isotype matched control mAb HO-1 (Ctrl) following an incubation at indicated times at 37°C in a 5% CO2 atmosphere are shown. Magnification is indicated (A) (right panel). (C) Thirteen human melanoma cell lines were incubated with mAb 3F8 (20 μg/ml). Following an up to 72 h incubation at 37°C in a 5% CO2 atmosphere, cell growth inhibition was determined by CCK-8 assay. Expression levels of GD2, defined as geometric mean (G.M.) fluorescence intensity of mAb 3F8 on the human melanoma cell lines tested (data not shown), was correlated with % of growth inhibition. R2 value as determined by the two order polynomial regression is indicated. The results presented are representative of those obtained in at least two independent experiments. (D) HTB63 cells were incubated with a mixture of mAb 3F8 (30 μg/ml) and anti-id mAb A1G4 (30 μg/ml). A mixture of mAb 3F8 and mAb MK2–23 (30 μg/ml) was used as a specificity control (Ctrl). Following an up to 48 h incubation at 37°C in a 5% CO2 atmosphere, cell growth inhibition was determined by CCK-8 assay. Data are expressed as mean ± standard deviations (SD) of the results obtained in three independent experiments.

