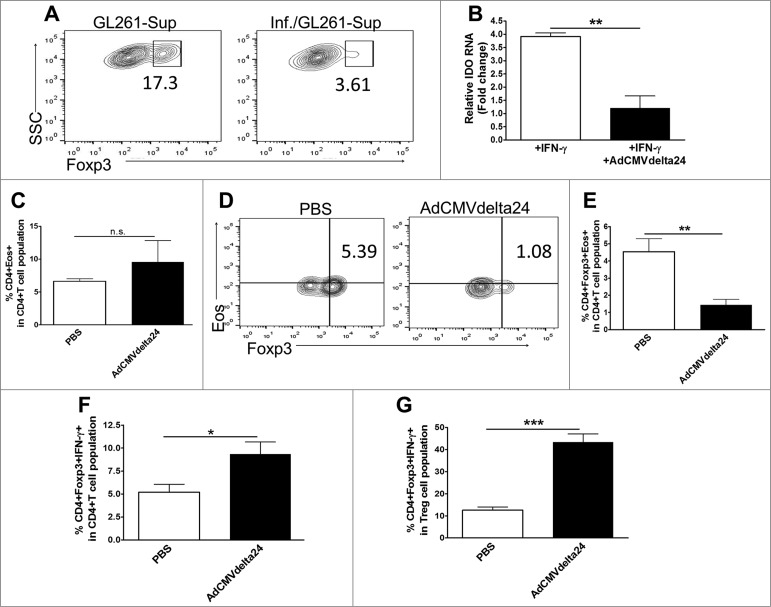
Figure 6.
Viral treatment downregulates the expression of Foxp3 in Treg cells and IDO in glioma cells and reprograms regulatory T cells. (A) Downregulation of Foxp3 expression in Treg cells. CD4+CD25+Treg cells sorted from the spleen and cLNs from C57/BL mice were stimulated with anti-CD3, anti-CD28 and IL-2, and incubated with the medium harvested from tumor cells. GL261 glioma cells were infected by AdCMVdelta24 at a MOI of 100 (Inf./GL261), or left uninfected (GL261), 4 h later, the cells were washed to remove viruses and incubated in the hypoxia chamber (1% O2). After 24 h, the supernatants were harvested and added into Treg cell culture. Treg cells were grown in the presence of conditioned-medium for 24 h and were analyzed by flow cytometry for intracellular expression of Foxp3. The cells were gated on CD4+ T cells. (B) Downregulation of IFNγ-induced IDO expression by GL261 glioma cells. GL261 cells were infected by AdCMVdelta24 at a MOI of 100 in the presence of 20 ng/mL mIFNγ (+IFNr+Adv). 24 h later, the cells were collected for q-PCR analysis of the expression of IDO. mIFNγ was used to induce IDO expression and served as a control (+IFNr). (C–H) Mice bearing 5 d GL261 tumor were injected intratumorally by AdCMVdelta24 or PBS (n = 4 or 5 mice in each group). Two weeks later, mice were killed and flow cytometric analysis was performed on leukocytes isolated from brains. (C) The percentage of Eos-positive CD4+ among the total CD4+ T cell population was not different between two groups. (D–E) A decreased percentage of Eos-positive Tregs in the CD4+ T cell population was observed in viral treated mice; (D) Representative flow cytometry results (gated on CD4+ T cells) and (E) The quantitative data (mean±SEM). (F–G) An increased percentage of IFNγ-producing Foxp3+ helper Treg cells among total CD4+ T cell population (F) and among total CD4+Foxp3+ Treg cell populations (G). *p < 0.05, **p < 0.01, ***p < 0.001, and n.s., not significant (unpaired, two-tailed Student's t-test).

