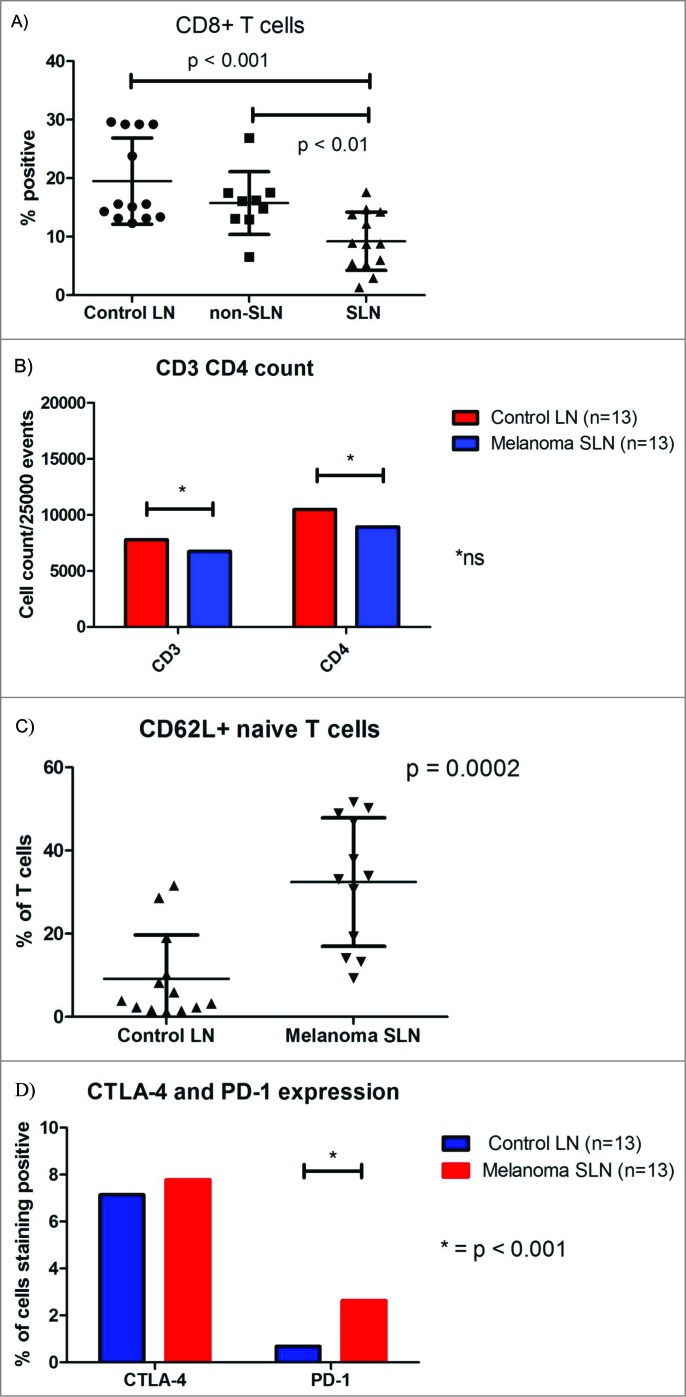
Figure 2.
(A) Box-plot illustrating the difference in median percentage of CD3+ CD8+ T cells. (B) Box-plot demonstrating differences in median percentage of CD3+ CD4+ and CD3+ and CD8+ T cells. (C) Box-plot demonstrating differences in median CD3+ CD62L+ cells (Controls n = 13, non-SLN n = 9 and melanoma SLN n = 13). (D) Box-plot illustrating differences in median percentage of CTLA-4 and PD-1 expression.

