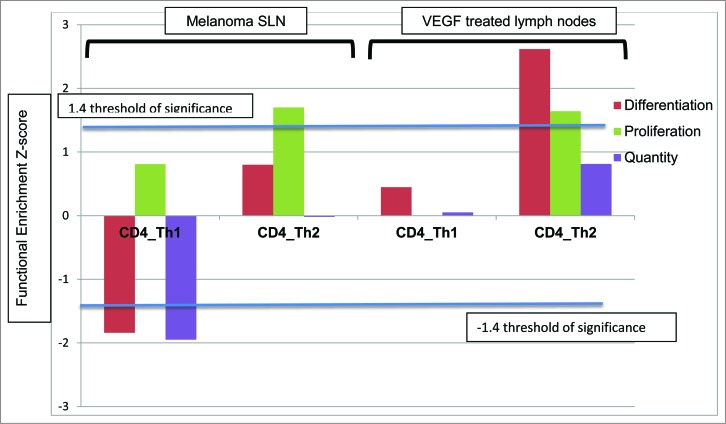
Figure 3.
Histogram demonstrating the functional enrichment z scores of Th1/Th2 pathways within CD4+ T cells of SLN draining melanoma compared to control LNs, respectively (n = 4) on the left and CD4+ T cells of control lymph nodes treated with VEGF compared to untreated control lymph nodes on the right (n = 3).

