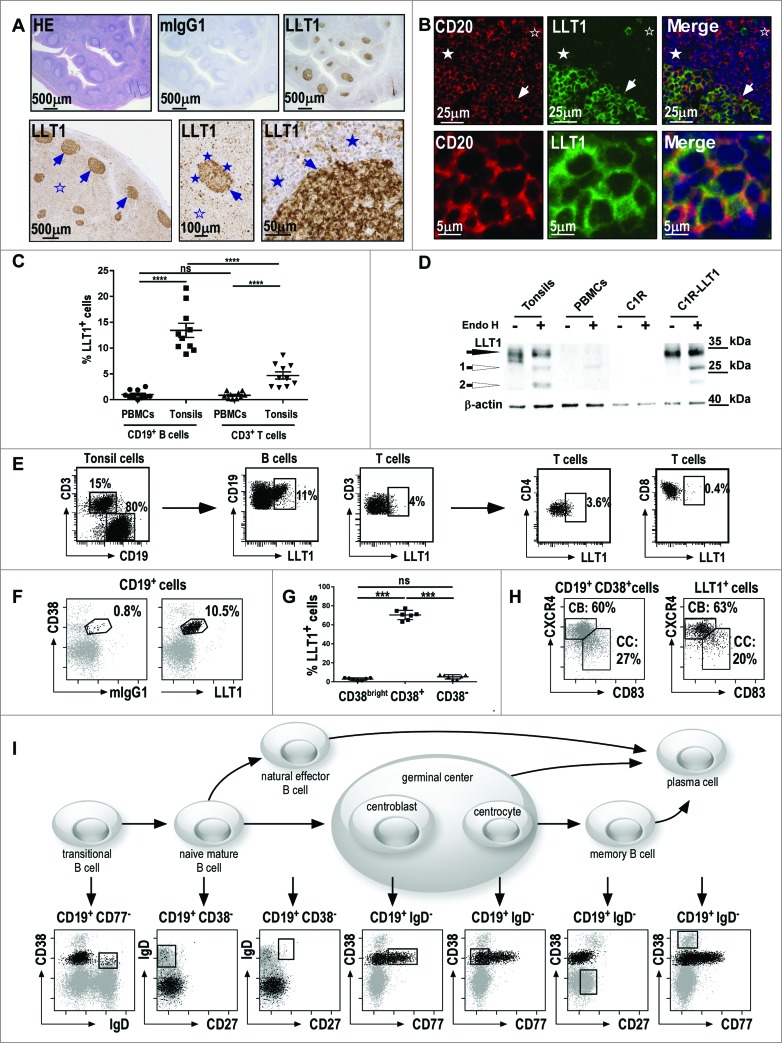
Figure 1 (See previous page).
Predominant expression of LLT1 in B cells from germinal centers. (A) IHC staining of FFPE sections from human tonsils (top panel) and human reactive lymph nodes (bottom panel) with hematoxylin (HE), isotype control or anti-LLT1 (clone 2F1). (B) Double immunofluorescence staining of FFPE tonsil sections using anti-CD20 or anti-LLT1 (clone 2F1) and colocalization together with Hoechst staining of nucleus. Top panel shows GC, mantel cell, and interfollicular (IFZ) zones and bottom panel shows GC B cells at higher magnification (A–B) show GCs (arrows) surrounded by mantle cell zone (filled stars) and IFZ (empty stars). Data are representative of 4 to 12 independent experiments. (C) Frequency among B and T cells in PBMCs and tonsils from flow cytometry analysis. n = 10, ****, p < 0.0001 Mann–Whitney U-test. (D) LLT1 detection by protein gel blot using anti-LLT1 (clone 2F1) in whole cell lysates of the indicated cells, digested or not with Endo H. β-actin is used as an internal control. Two differentially glycosylated forms of LLT1 are visualized: Endo H resistant form (black arrow) and Endo H sensitive form yielding two bands (white arrows 1 and 2). Data are representative of 2 independent experiments. (E–I) Multiparameter flow cytometry analysis of LLT1 expression. (E) Representative flow cytometry staining using anti-LLT1 (clone 4F68). (F) Representative expression of LLT1 and (G) frequency on gated CD19+ B cells analyzed according to CD38 expression. n =7, ***, p< 0.001 Mann–Whitney U-test. (H) Distribution of centroblast (CB) and centrocyte (CC) populations within CD19+ CD38+ and LLT1+ CD19+CD38+ gated tonsil cells according to the expression of CXCR4 and CD83. 35,36 (I) Scheme of the differentiation stages of mature B-cell development adapted from. 34 Each stage of B cell differentiation is visualized in the rectangles in the dot-plots below. Cells (gray dots) were gated using the markers indicated above each dot-plot and displayed according to markers on the dot-plot axis. On these dot-plots, an overlay of the gated CD3−CD19+LLT1+ B cells is shown and LLT1+ cells are visualized as black dots. (E–F–H–I) Data are representative of 3–6 independent experiments.

