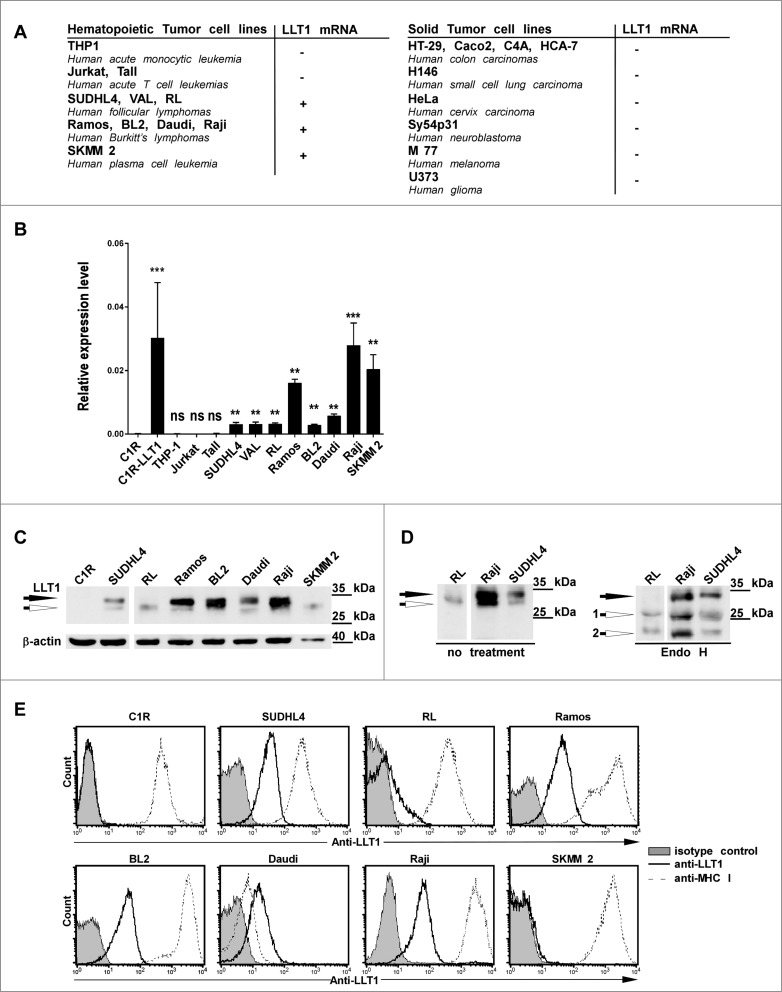
Figure 3.
LLT1 expression in B lymphoma cell lines. (A–B) CLEC2D transcript variant 1 coding for LLT1 quantified by real-time RT-PCR in the indicated cell lines, summarized in (A) and expressed relative to β-actin in (B). Statistical significance against LLT1− C1R cells was calculated n = 4 to 30, ***, p < 0.001, **, p< 0.01, Mann–Whitney U-test. (A–B) Data are representative of 3 independent experiments. (C–D) LLT1 expression detected by protein gel blot analysis of whole cell lysates digested or not with Endo H using anti-LLT1 mAb (clone 2F1). β-actin is used as an internal control. Two differentially glycosylated forms of LLT1 are visualized: Endo H resistant form (black arrow) and Endo H sensitive form (white arrows 1 and 2). Data are representative of 3 experiments. (E) LLT1 cell surface expression monitored by flow cytometry with anti-LLT1 mAb (clone 4F68) compared to isotype mIgG1 control and anti-MHC class I mAb (clone DX17). Data are representative of 8 independent experiments.

