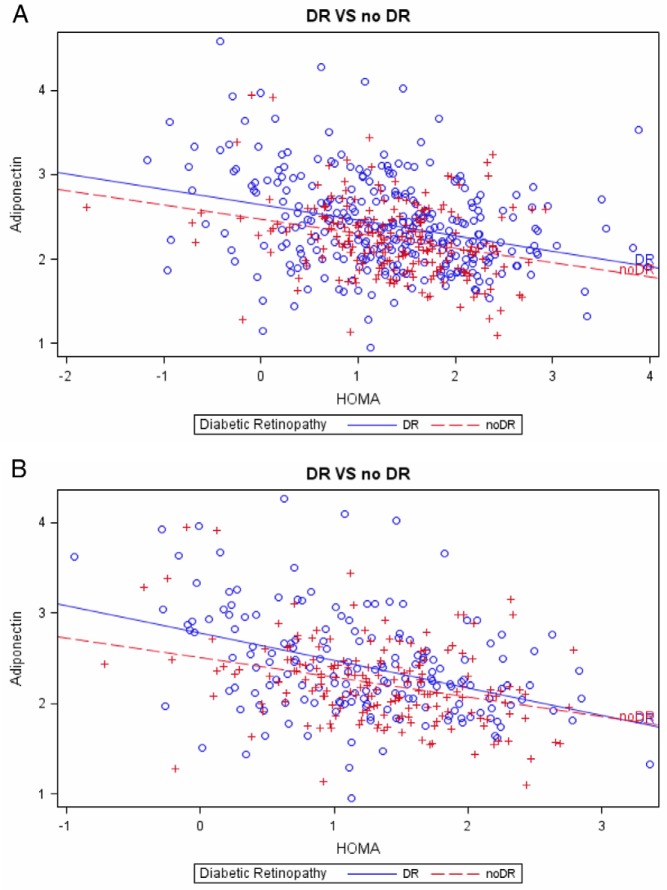
Figure 2.
Scatter plots of the relationship between lnAdiponectin and lnHOMA-IR in participants with DR (○—○; solid line) and without DR (+—+; dotted line), conducted in all patients (n = 507) (A) and in a subset of patients not using exogenous insulin (n = 356) (B). Slopes of the regressions in each panel are similar. Intercepts are different in panels A and B.

