
Fig. 3.
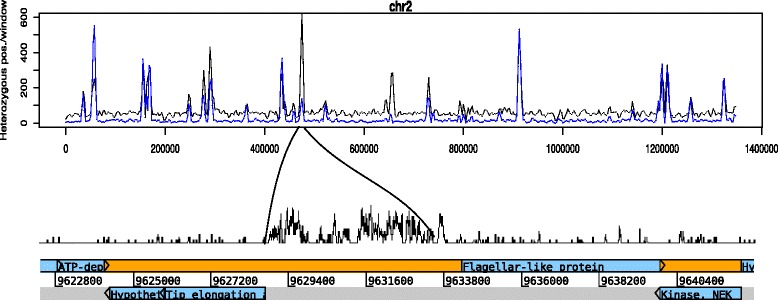
Close-up of ASH in a specific intergenic region on chromosome 2. The blue line represents ASH in isolate AS175 (assemblage AII-1) and grey line represents ASH in isolate AS98 (assemblage AII-2)
Official websites use .gov
A
.gov website belongs to an official
government organization in the United States.
Secure .gov websites use HTTPS
A lock (
) or https:// means you've safely
connected to the .gov website. Share sensitive
information only on official, secure websites.
Close-up of ASH in a specific intergenic region on chromosome 2. The blue line represents ASH in isolate AS175 (assemblage AII-1) and grey line represents ASH in isolate AS98 (assemblage AII-2)