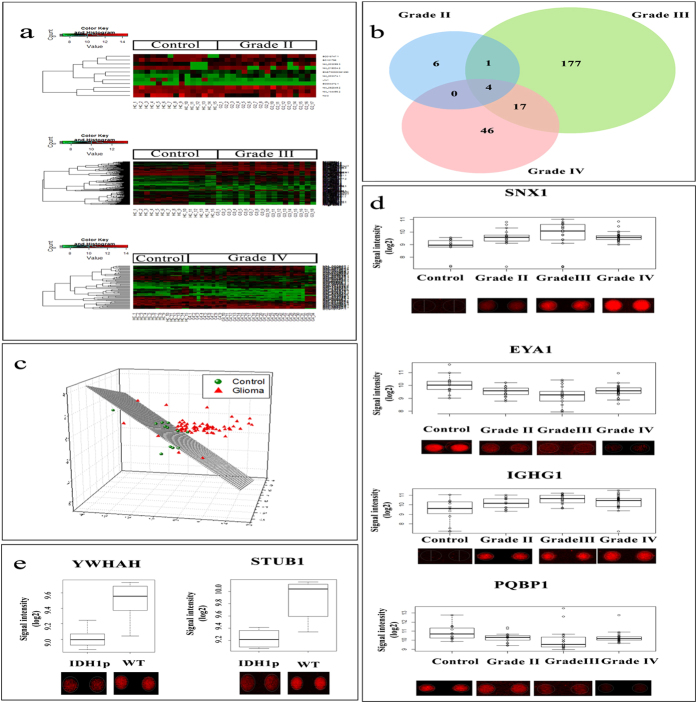
Figure 2. Differentially expressed proteins.
(a) represents heat-maps of comparisons of healthy controls with various grades of glioma using their respective differentially expressed proteins. (b) shows the number of unique and overlapping proteins dysregulated in various grades of glioma compared to the healthy controls. (c) represents the MDS plot highlighting poor discrimination of healthy controls from glioma samples using 4 commonly dysregulated proteins, SNX1, EYA1, PQBP1 and IGHG1. Their expression patterns across different sample types have been shown in panel (d) along with their spot intensity patterns on the microarray slides. (e) represents the expression patterns and spot intensities of few significantly dysregulated proteins in Grade II IDH1p cohort against Grade II glioma patients with WT IDH1.

