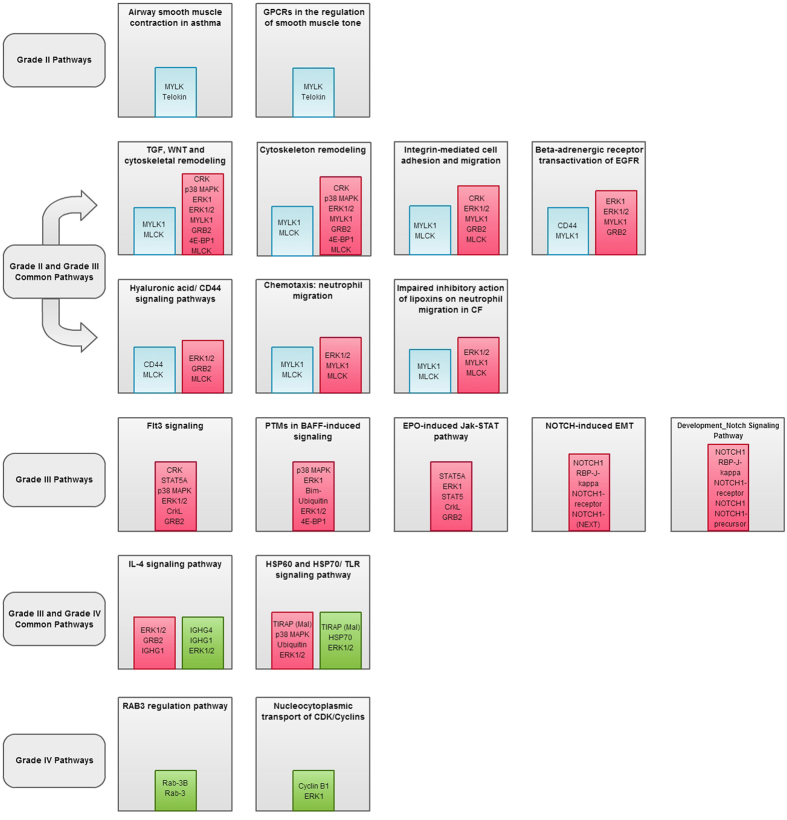
Figure 3. Enriched Pathways emerging from TAAs in each grade.
Figure 3 schematically represents the enriched pathways emerging from deregulated TAAs in each grade. The proteins attributed to these pathways are highlighted in colour-coded panels. The pathways common between grades have also been represented in the above panels. Blue coloured panels denote proteins from Grade II, red coloured panels represent proteins from Grade III and green coloured panels signify proteins from Grade IV in any given pathway. These images were created from the data generated by GeneGoMetacore.

