
Figure 6. Differential genes and functional classification from DEGs.
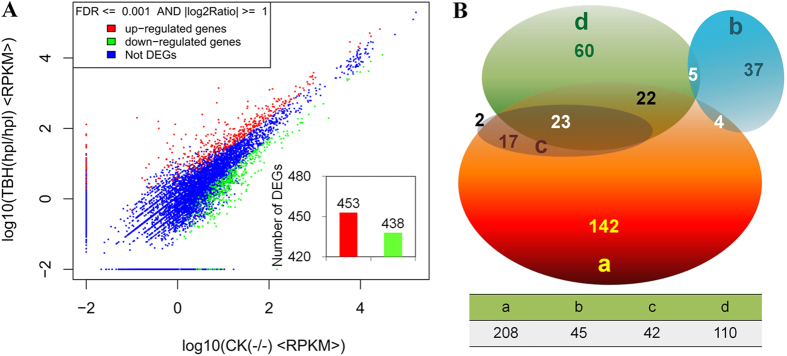
(A) Gene expression level of WT vs TBH. The 453 up-regulated genes are shown in red, and 438 down-regulated genes in green (insert, bottom right). DEGs (891) were genes with FDR ≤ 0.001 and fold difference of less than 2. (B) Pathways (Q value ≤ 0.05) were significantly enriched from 312 DEGs. a, Protein Metabolism; b, Protein Processing and Export; c, Energy Supply to Cells; d, Stress and Repair. TBH (Hpl/Hpl) was the mutant system for which the BmPSG of 5th instar larvae specifically expressed the Hpl gene (Fig. 2). The most typical biological phenotype was the retardation of the BmPSG of late 5th instar larvae (Fig. 3), so we chose the BmPSG of the wandering stage silkworm for DEGs analysis, which are about to spin.