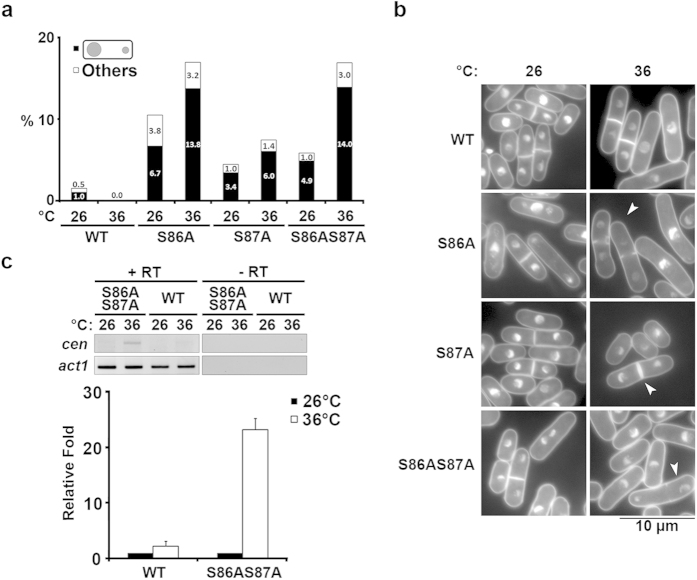
Figure 2. hht2-S86A, hht2-S87A and hht2-S86AS87A mutants exhibit chromosome missegregation defects.
(a) Frequency of cells exhibiting chromosome missegregation phenotypes in WT, hht2-S86A, hht2-S87A and hht2-S86AS87A cultures at 26 °C and 36 °C. Black: unequal chromosome segregation; white: all other chromosome missegregation phenotypes. N = 200. Results shown are representative of two experiments. (b) Nuclear morphology of strains used in (a). Arrowhead depicts a cell with unequal chromosome segregation. Scale bar: 10 μm. (c) Top: End-point RT-PCR for centromeric DNA sequence derived-transcript (cen: 5′ TTACGCTTCACCTAGTTTCC 3′ and 5′ ATTATTTTCCAGTATGCTGATG 3′) of wild-type (WT) and hht2-S86AS87A (S86AS87A) at 26 °C and 36 °C. The result shown is representative of three experiments. The act1+ (act1) gene serves as a loading control. -RT: no reverse transcription control. Bottom: Relative band intensity quantification from three experiments. Error bars represent mean ± S.D.

