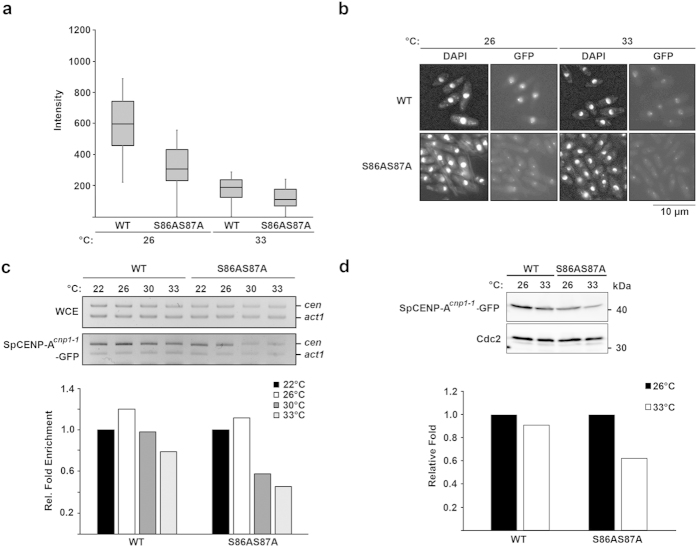
Figure 4. Localization of centromere protein SpCENP-Acnp1-1-GFP is disrupted in hht2-S86AS87A.
(a) Box plot of SpCENP-Acnp1-1-GFP intensity measured for WT and hht2-S86AS87A cells growing at 26 °C and shifted to 33 °C for 4 h. (b) Microscopic observation of SpCENP-Acnp1-1-GFP and nuclear staining (DAPI) of strains used in (a). Scale bar: 10 μm. (c) ChIP assay of SpCENP-Acnp1-1-GFP in WT and hht2-S86AS87A cells first grown at 26 °C and then shifted to 22 °C (6 h), 30 °C (4 h), or 33 °C (4 h). ChIP was analysed with competitive PCR using primers specific for the centromere core (cen: 5′-TTACGCTTCACCTAGTTTCC-3′ and 5′-ATTATTTTCCAGTATGCTGATG-3′) and control gene (act1) (top). The relative fold enrichment shown in the graph below was calculated by comparing the cen/act1 ratio between ChIP and whole-cell extracts (WCE). The value was normalized according to that at 22 °C for each strain. (d) Protein expression of SpCENP-Acnp1-1-GFP in WT and hht2-S86AS87A growing at 26 °C and shifted to 33 °C for 4 h (top). Relative band intensity quantification shown in the bar graph (below). Results shown are the representative of two experiments.

