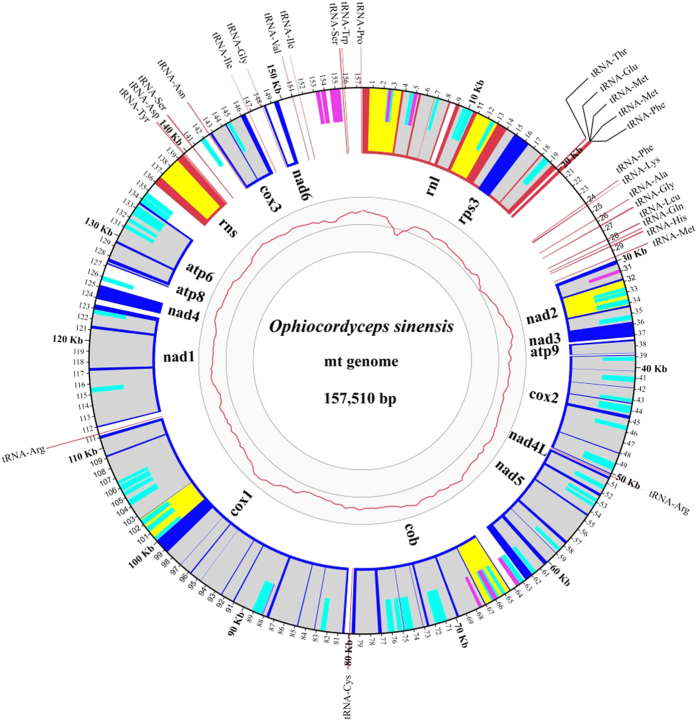
Figure 1. Genetic map of the mitochondrial genome of Ophiocordyceps sinensis.
Dark blue radial lines or blocks indicate exons of conserved protein-coding genes, with gene names labelled on the inner circle; red boxes indicate the rnl and rns genes with the rps3 nested within an intron of the rnl gene; thin red lines protruding outside of the outer circle indicate tRNAs. Introns are shown in shading as group I (grey), group II (yellow) or unclassified (white). Intronic and, less frequently, intergenic predicted ORFs (ncORFs > 300 bp) were shown as half-height bars representing sense strand of ncORFs (light blue) or anti-sense strand of ncORFs (magenta). The initiation codon of rnl gene was set as the start of mtDNA. Three fine inner circles represented sequence coverage with the outermost at 800× and the innermost at 0×.

