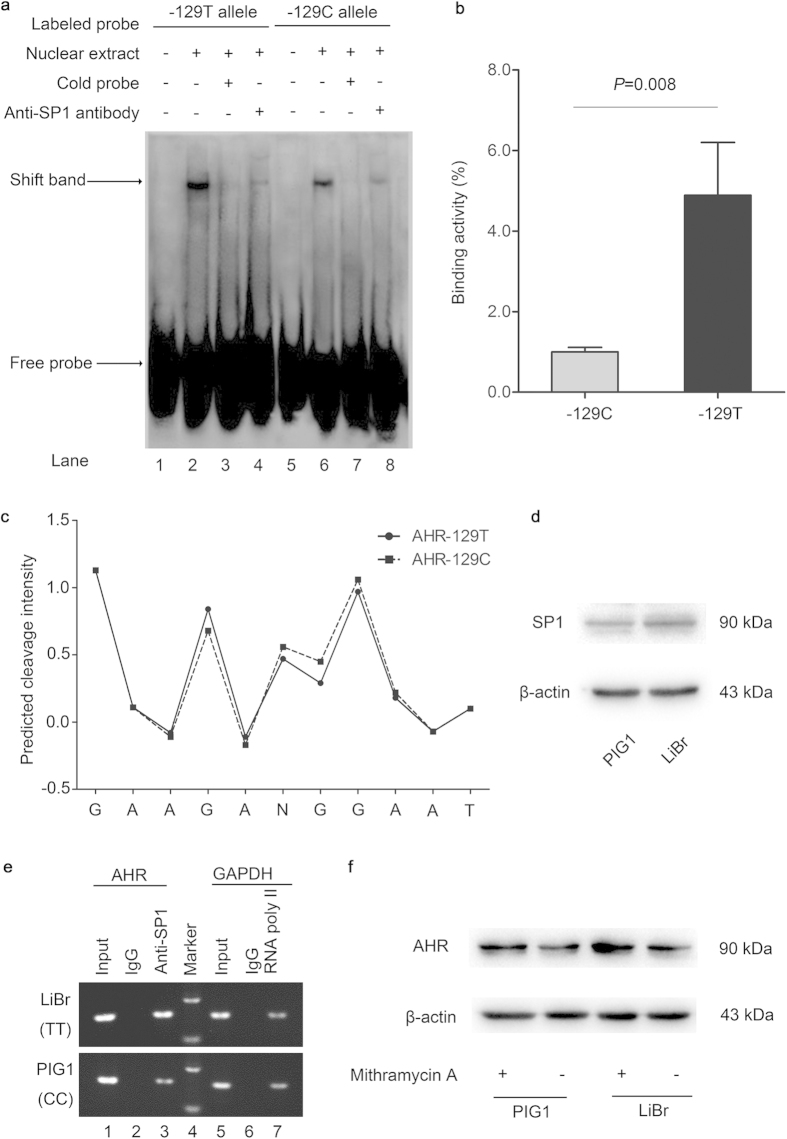
Figure 2. Analysis of SP1 binding to the AHR promoter around −129C > T polymorphism.
(a) Electrophoretic mobility shift assay with biotin-labeled either −129C or −129T probes and PIG1 cell nuclear extracts. Lanes 1 and 5, mobilities of the labeled −129C or −129T probes without nuclear extracts; lanes 2 and 6, mobilities of the labeled −129C or −129T probes with nuclear extracts in the absence of competitor; lanes 3 and 7, shifted bands were abolished by 100-fold unlabeled cold probes; lanes 4 and 8, super shift assays incubating with anti-SP1 antibody showed the supershifted protein complex. (b) Quantification of bands in Fig. 2a (lanes 2 and 6) was done using ImageJ software (National Institutes of Health), with the C allele binding being defined as 100%. Results are from three independent experiments with similar results. (c) Allelic difference in DNA surface structure was detected at AHR −129C > T polymorphism by using predicted hydroxyl radical cleavage patterns. (d) Western blots showed that PIG1 and LiBr cells expressed relative levels of SP1 protein. (e) Chromatin immunoprecipitation assay with PIG1 cells (−129CC genotype) and LiBr cells (−129TT genotype) in the presence of anti-SP1 (lane 3), anti-RNA Polymerase II (positive control; lane 7) antibodies, or control IgG (negative control; lane 2 and 6). (f) The SP1 inhibitor mithramycin A suppressed the expression of AHR protein in PIG1 and LiBr cells, measured by western bolts. These data confirm the biological interaction between SP1 and AHR promoter influenced by the −129 C > T polymorphism.

