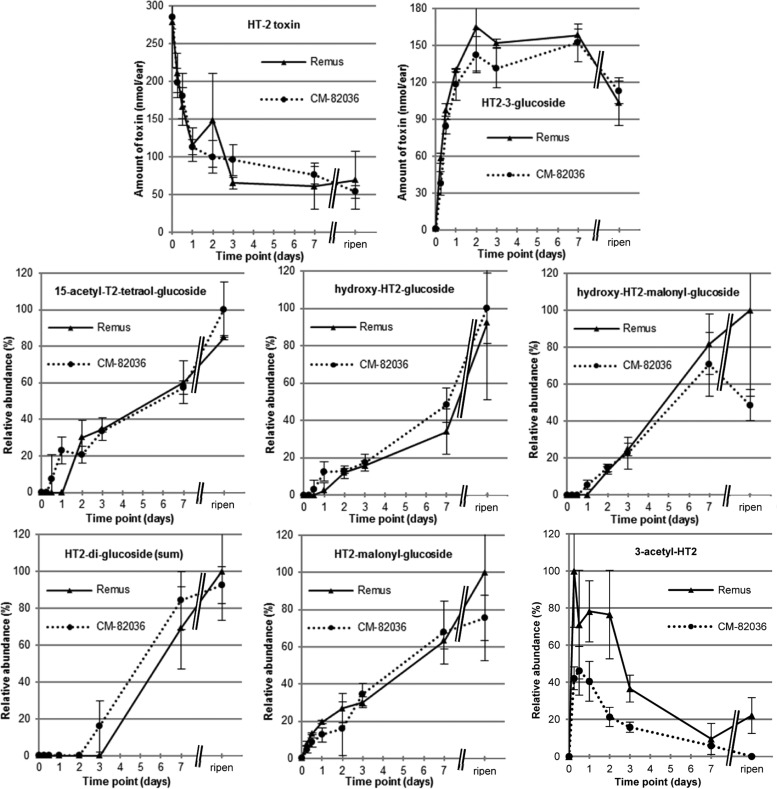
Figure 2.
Results from the time course kinetics experiment. After exposure to a single dose of 200 μg/ear HT-2 toxin (HT2), the whole ears (n = 3) were harvested immediately after treatment (0 h), after 6 h, 12 h, 1 day, 2 days, 3 days, and 1 week, as well as at full ripening (ca. 8 weeks after treatment). For the parent toxin (HT2) and the major metabolite HT-2 toxin-3-glucoside, the absolute amounts (in nanomoles per ear) are provided together with the standard deviation of the biological triplicate. These values are based on quantitative measurements using the respective analytical standards and are corrected for matrix effects occurring during liquid chromatography–mass spectrometric analysis; the individual ear weights were taken into consideration. For all other metabolites no analytical standard was available; therefore, the relative abundances (in percent) are provided together with the standard deviation of the biological triplicate. Those values are based on the peak areas of the ammonium adduct (for 3-acetyl-HT-2 toxin the sodium adduct was used) multiplied with the individual ear weight. All values were set into correlation with the highest observed normalized area (usually the full ripening samples of Remus or CM-82036).

