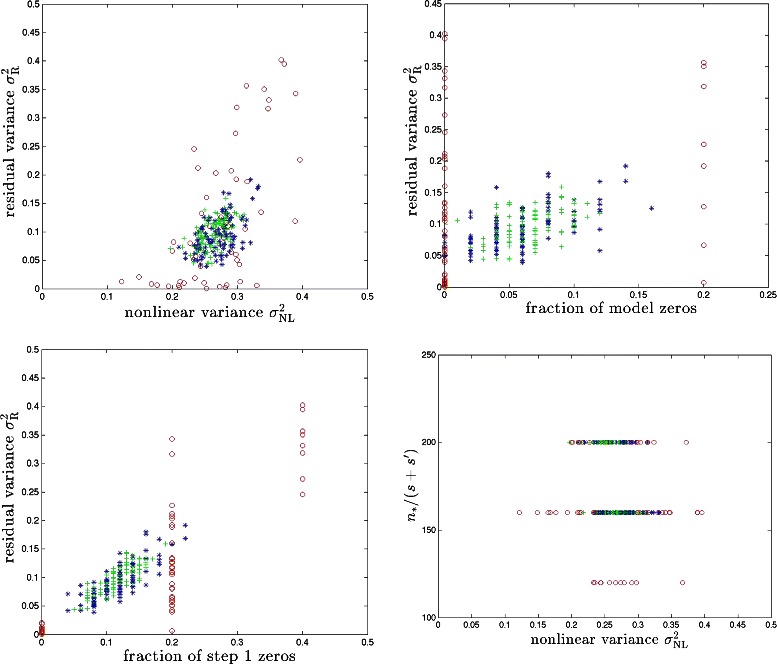
Fig. 5.

PS model with synthetic genomes. Red, blue and green symbols correspond to cases with s+s′=5,50,100 respectively. Results for 100 runs (i.e., 100 different realizations of the model) are shown for each case

PS model with synthetic genomes. Red, blue and green symbols correspond to cases with s+s′=5,50,100 respectively. Results for 100 runs (i.e., 100 different realizations of the model) are shown for each case