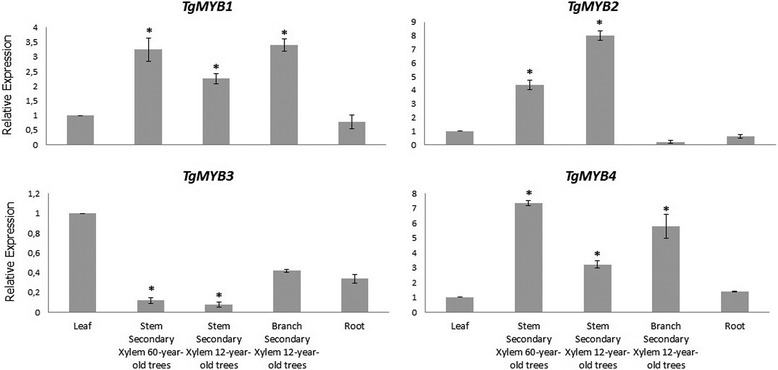
Fig. 9.

Expression of teak MYB genes with the qRT-PCR method. Relative quantification of expression was examined in different tissues (leaf, root, stem and branch secondary xylem from different ages). The name of each gene is indicated at the top of each histogram. Tissues considered are shown at the bottom of the diagrams. ± means SE of three biological replicate samples. *p < 0.05 according to F-test. Y-axis indicates the relative expression level of each gene compared to the control tissue (leaves). EF1α was the endogenous control used according to [95]
