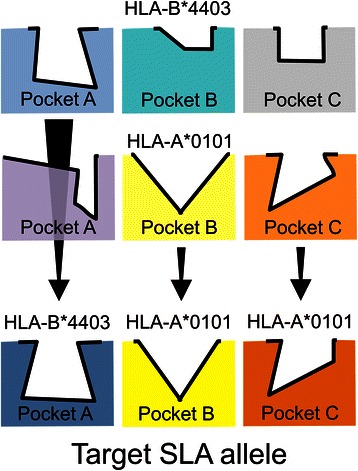
Fig. 1.

Illustration of PigMatrix development using the pocket profile method. Three pockets (A, B, and C) from human (HLA) and swine (SLA) MHC molecules are represented as different shapes and colors. The contours of the pockets are shown in bold black lines. HLA pockets from two HLA alleles (HLA-A*0101 and B*4403) are shown in the first two rows. For each pocket in a target SLA, in the third row, we identified the most similar HLA pocket (best human match) and combined their pocket profiles (binding preferences expressed as coefficients) to build composite predictive matrices (PigMatrix)
