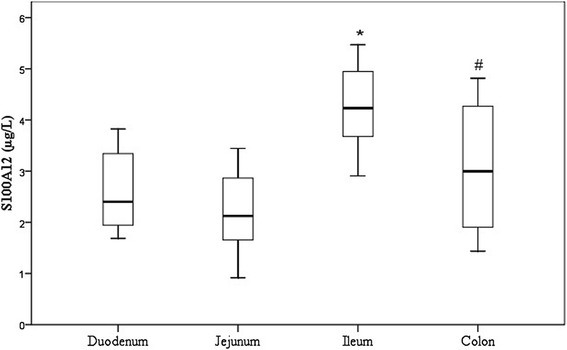
Fig. 1.

Boxplot representing the log-transformed S100A12 concentrations in the intestinal mucosal samples of 12 healthy dogs. The horizontal line inside each box represents the median; the top and bottom of each box represent the 75th and 25th percentiles, respectively; and the whiskers represent the 95th and 5th percentiles. * p < 0.05 vs. duodenum, jejunum and colon; # p < 0.05 vs. jejunum
