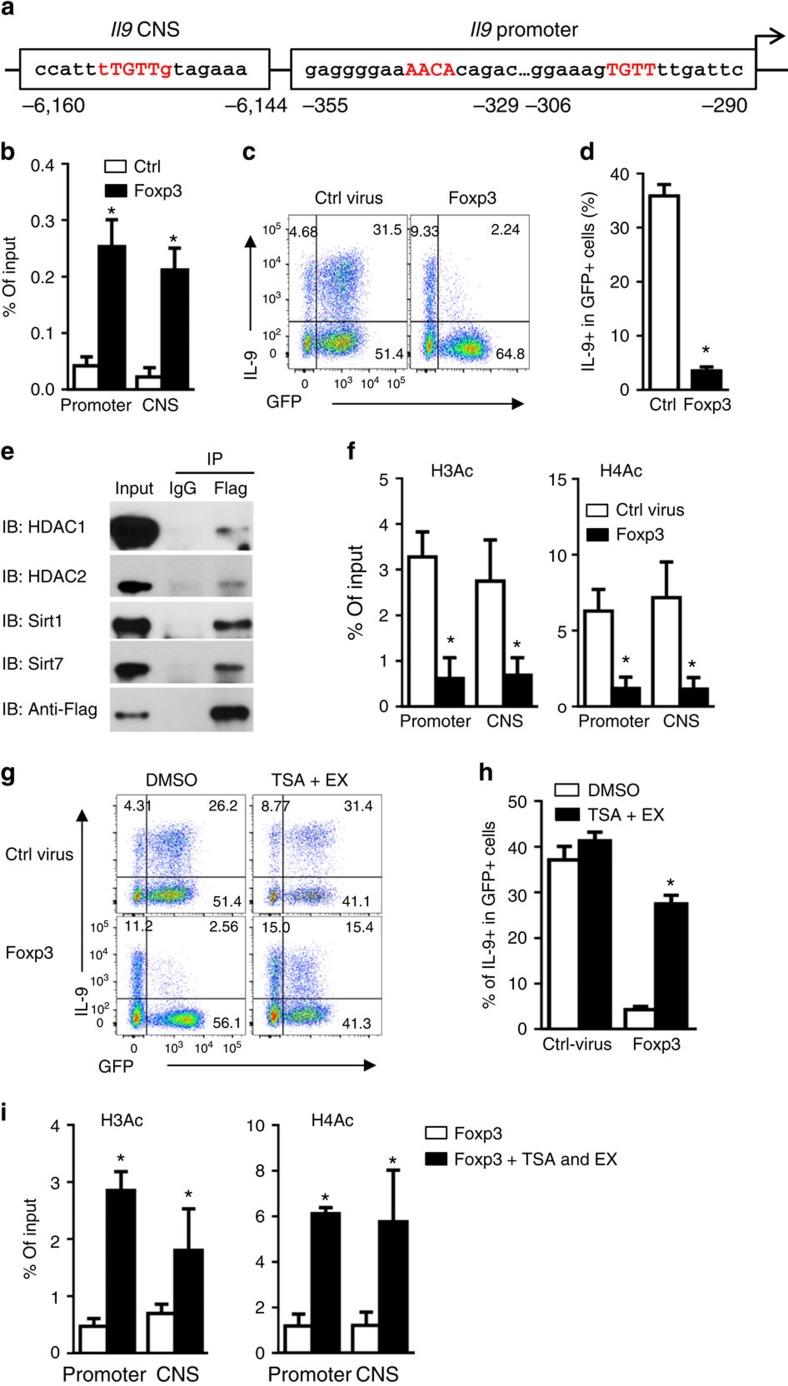
Figure 5. Foxp3 binds to the Il9 locus and inhibits IL-9 expression by recruiting histone deacetylases.
(a) Graph depicting Il9 locus and putative Foxp3 binding sites (red) at the Il9 promoter and CNS regions. (b) ChIP analysis of Foxp3 binding to the Il9 gene locus in CD4+ T cells transduced with retrovirus expressing GFP alone (Ctrl) or GFP-Flag-Foxp3 (Foxp3), then cultured under iTreg-polarizing conditions in the presence of DTA-1. GFP+ cells were sorted and fixed for ChIP using anti-Flag antibody. Data represent mean values±s.d. (n=3). (c,d) Flow cytometry plots showing IL-9-producing cells in CD4+ T cells transduced with retrovirus expressing GFP alone or Foxp3-GFP, and cultured under iTreg-polarizing conditions for 3 days in the presence of DTA-1. Numbers indicate the percentage of cells in the quadrants (c). Graph depicts the percentage of IL-9+ cells in GFP+ population (d). Data represent mean values±s.d. (n=6). (e) Co-immunoprecipitation of flag-foxp3 in CD4+ T cells transduced with retrovirus expressing flag-foxp3, and cultured under iTreg-polarizing conditions for 2 days. Anti-flag and control IgG immunoprecipitates (IP) were subjected to immunoblot analysis (IB) with anti-HDAC1, anti-HDAC2, anti-Sirt1 and anti-Sirt7 antibodies, and representative plots of 3 experiments are shown. (f) ChIP analysis of H3Ac and H4Ac modifications at Il9 promoter and CNS regions in GFP+ cells sorted from naive CD4+ T cells transduced and activated as in (b) for 2 days. Data represent mean values±s.d. (n=3). (g,h) Flow cytometry analysis of IL-9-producing cells in naive CD4+ T cells transduced and activated as in (c) for 3 days in the presence or absence of HDAC inhibitor Trichostatin A (TSA, 2 nM) and Sirt1 inhibitor EX-527 (EX, 0.5 μM). Numbers in the quadrants indicate the percentage of positive cells (g). Graph depicts the percentage of IL-9+ cells in GFP+ population. Data represent mean values±s.d. (n=9) (h). (i) ChIP analysis of H3Ac and H4Ac modifications at Il9 promoter and CNS regions in Foxp3−GFP+ cells sorted from naive CD4+ T cells transduced with retrovirus expressing Foxp3-GFP and cultured as in (g) for 2 days. Data represent mean values±s.d. (n=3). P values were determined by Student's t-test (*P<0.05).

