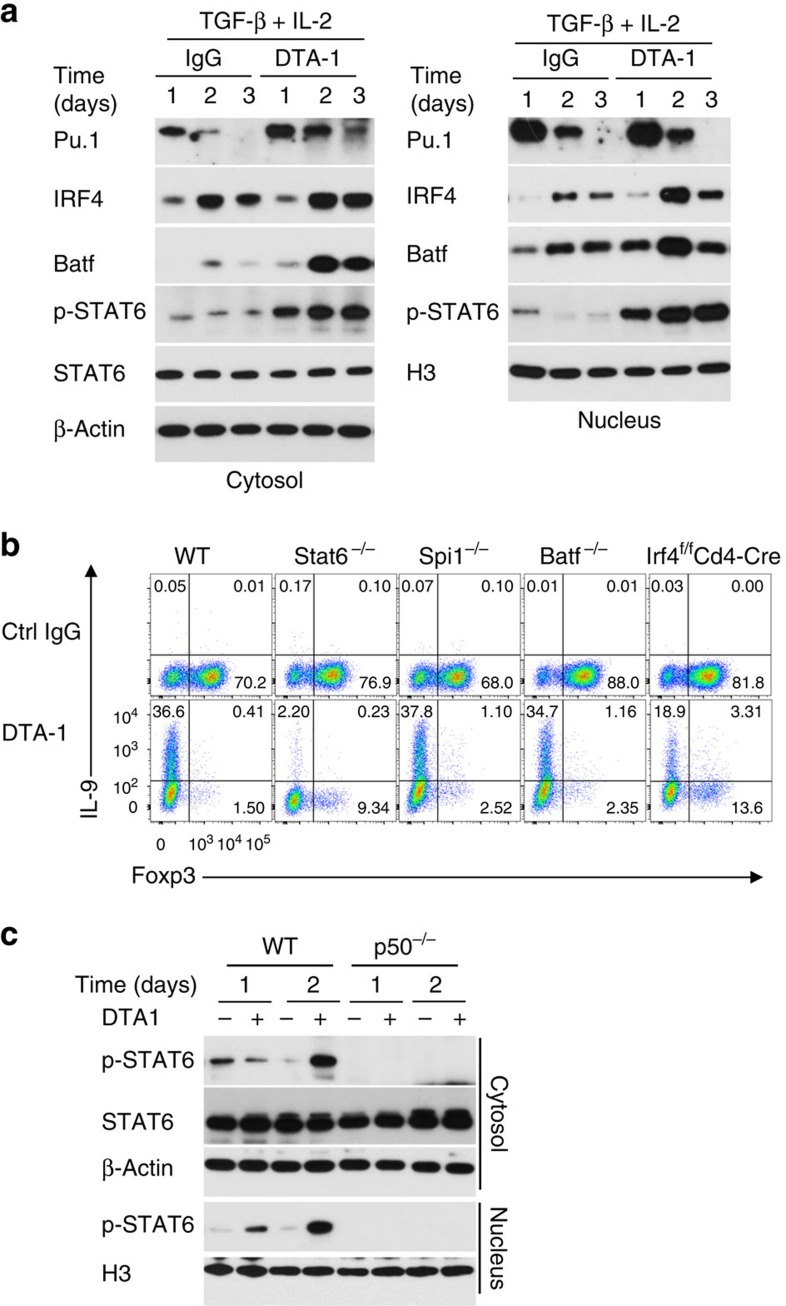
Figure 6. Role of Th9 associated transcription factors in GITR-mediated induction of iTregs and Th9 cells.
(a) Immunoblot analysis of PU.1, IRF4, BATF, STAT6, and p-STAT6 in WT naive CD4+ T cells activated for 1 to 3 days under iTreg-polarizing conditions with DTA-1 or control IgG. Data shown are representative of two independent experiments. (b) Induction of Foxp3+ T cells and IL-9+ T cells from WT B6, Stat6−/−, Spi1−/−, Irf4f/fCd4-Cre, and Batf −/− CD4+ T cells activated under iTreg conditions for 3 days with or without GITR ligation. Numbers in the quadrants indicate the percentage of cells. Data are representative of five independent experiments. (c) Immunoblot analysis of STAT6 and p-STAT6 in WT B6 and p50−/− naive CD4+ T cells activated for 1 to 2 days under iTreg-polarizing conditions with DTA-1 or Ctrl IgG. Data are representative of two independent experiments.

