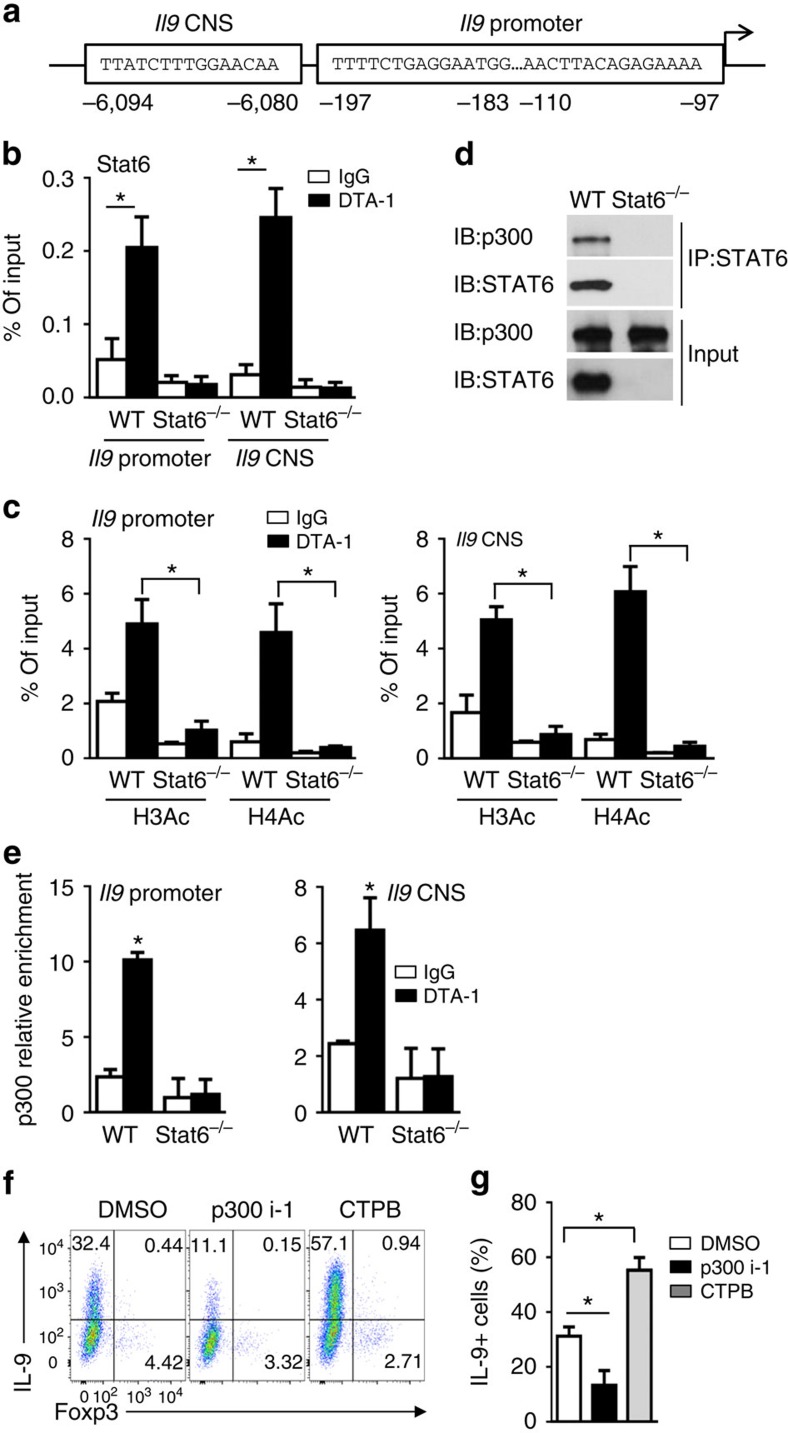
Figure 7. Role of STAT6 and P300 in GITR-mediated hyperacetylation of Il9 locus.
(a) Graph showing the Il9 locus and putative STAT6 binding sites at the Il9 promoter and CNS regions. (b) ChIP analysis of the binding of STAT6 to Il9 locus in WT B6 and Stat6−/− naive CD4+ T cells activated under iTreg-polarizing conditions for 2 days in the presence of DTA-1 or control IgG. Data are representative of three independent experiments. (c) ChIP analysis of H3Ac and H4Ac modifications in Il9 promoter (top) and CNS regions (bottom) in WT B6 and Stat6−/− naive CD4+ T cells activated as in (b) for 2 days. Data are representative of three independent experiments. (d) Co-immunoprecipitation analysis of STAT6 in WT B6 and Stat6−/− naive CD4+ T cells activated as in (b). Anti-STAT6 immunoprecipitates (IP) were subjected to immunoblot analysis (IB) with anti-P300 and anti-STAT6 antibodies. Data are representative of three independent experiments. (e) ChIP analysis of p300 binding to the Il9 promoter and CNS in WT B6 and Stat6−/− naive CD4+ T cells activated as in (b) for 2 days. Data are representative of three independent experiments. (f,g) Flow cytometry analysis of IL-9 and Foxp3 expression by WT B6 naive CD4+ T cells activated as in Fig. 5g for 3 days in the presence or absence of p300/CBP inhibitor 1 (p300i-1, 4 μM) or p300 HAT activator (CTPB, 50 μM). Numbers in the quadrants indicate the percentage of cells (f). The graph represents Mean±s.d. of IL-9+ T cells from three independent experiments with triplicate cultures (g). P-values were determined by Student's t-test (*P<0.05).

