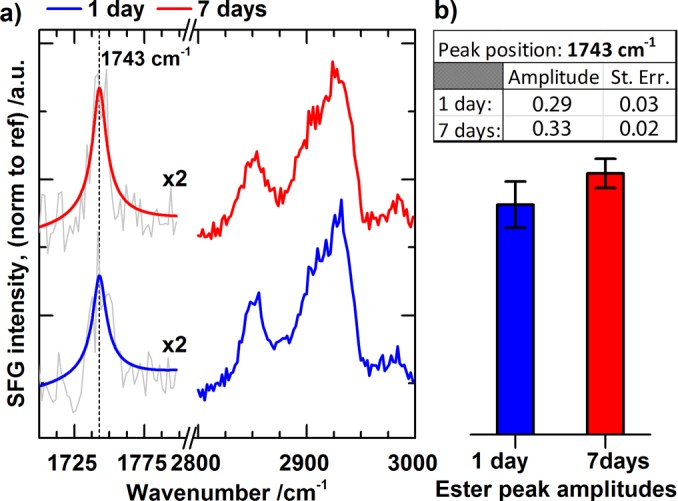
Fig. 3.

(Color online) SFG spectra of the C-H region (2800–2900 cm−1) for ClSi films functionalized for 1 day (blue) and 7 days (red), respectively. For the ester region at 1743 cm−1, the gray traces are averaged data, while the blue and red traces are fits made with Eq. (3). The vertical line at 1743 cm−1 denotes the peak position for the fits. For the C-H region, only the averaged data are presented. The amplitudes of the fits in the ester region, with error bars showing standard errors of the fits, are included in the table and bar-plot. The data indicate that the films prepared for 1 day and 7 days reaction times are of similar quality.
