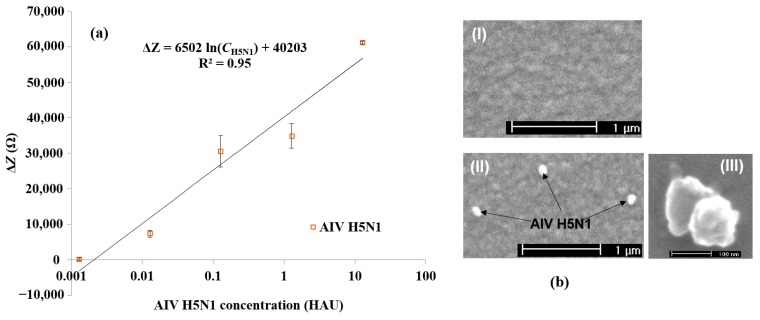
Figure 3.
(a) Average impedance change caused by different concentrations of AIV H5N1. The values of the horizontal axis correspond to serial dilution values of 128 HAU virus sample (12.8–0.00128 HAU). Error bars are based on the standard deviation of triplicate tests. The impedance was measured at the frequency of 25.8 kHz; (b) ESEM micrographs of the electrode surface with immobilized aptamers (I) before and (II,III) after AIV capture.

