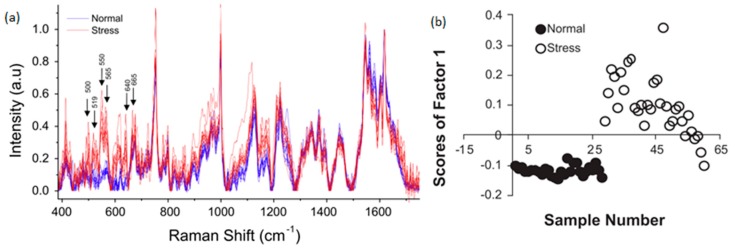
Figure 10.
(a) Raman spectra from 10 normal cells and 10 cells exposed to oxidative stress. The variations between each spectra illustrate the cell-to-cell variation. Nonetheless, despite broadly similar Raman spectra; a PCA shown in (b) clearly differentiates between the stressed and unstressed cells [68] (With permission from Elsevier).

