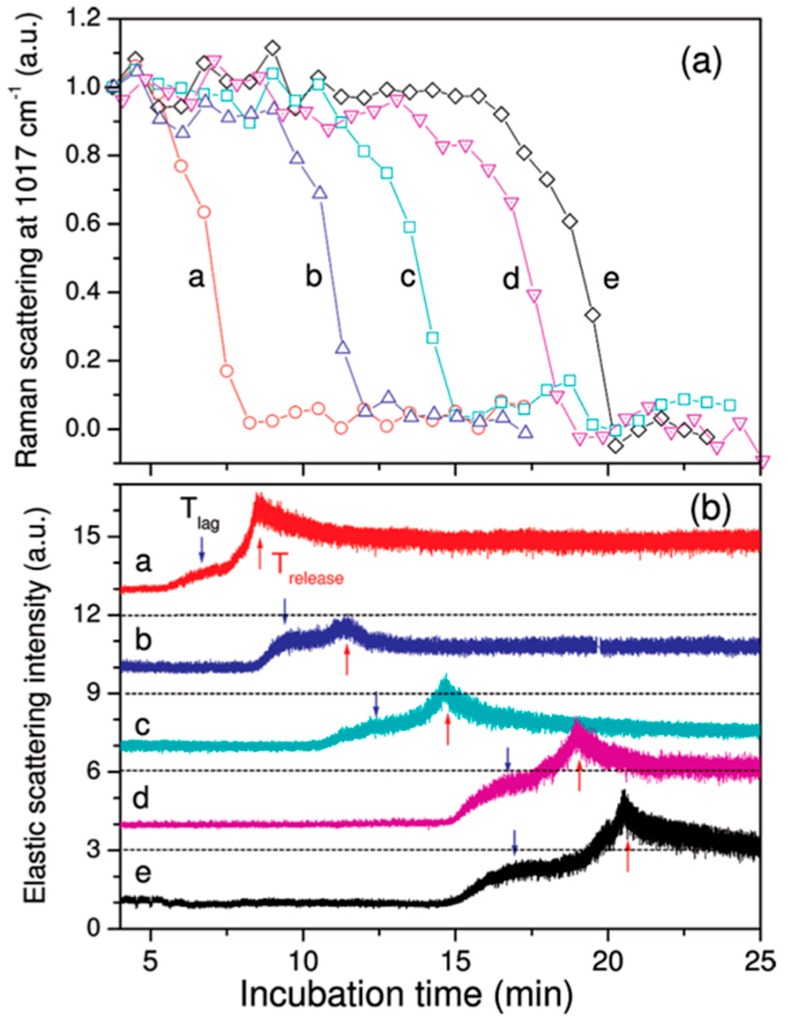
Figure 13.
The Raman line (a) associated with the calcium dipicolinate biomarker is monitored during the spore germination process along with the intensity of elastic scattered light; (b) for varying particles. The individual particles show different germination times, indicated by the rapid decrease in the Raman scattering line at 1017 cm−1 (a); but the germination process is consistently correlated with an increase in the elastic scattering of the cell (b) [61]. (With permission from ACS publications).

